OPEN-SOURCE SCRIPT
ES + NQ vs VIX Risk-On / Risk-Off Toolkit [SB1]
ES + NQ vs VIX Risk-On / Risk-Off Toolkit [SB1] — Indicator Description
This toolkit provides a full market-sentiment dashboard by comparing S&P 500 (ES), Nasdaq 100 (NQ), and VIX behavior in real time. It is designed to quickly identify when conditions align into Risk-On, Risk-Off, or Neutral market states and to highlight high-conviction candles that support trend continuation.
🔹 Core Logic
The script evaluates:
ES & NQ Candle Bias
Each index is classified as Bullish, Bearish, or Neutral based on its current candle (close vs open).
VIX Direction
Rising VIX = Risk-Off pressure
Falling VIX = Risk-On relief
Market Sentiment Alignment
Risk-On: ES Bullish + NQ Bullish + VIX Falling
Risk-Off: ES Bearish + NQ Bearish + VIX Rising
Neutral: Anything not aligned
🔹 Normalized Trend Strength (n-value)
The indicator introduces a normalized trend metric for both ES and NQ:
Uses fast and slow EMAs to measure directional strength
Normalizes the EMA distance by ATR
Produces an n-value that shows trend intensity regardless of volatility regime
Alerts trigger when the trend reaches a configurable strength range
This helps identify when either index is entering a strong trend environment.
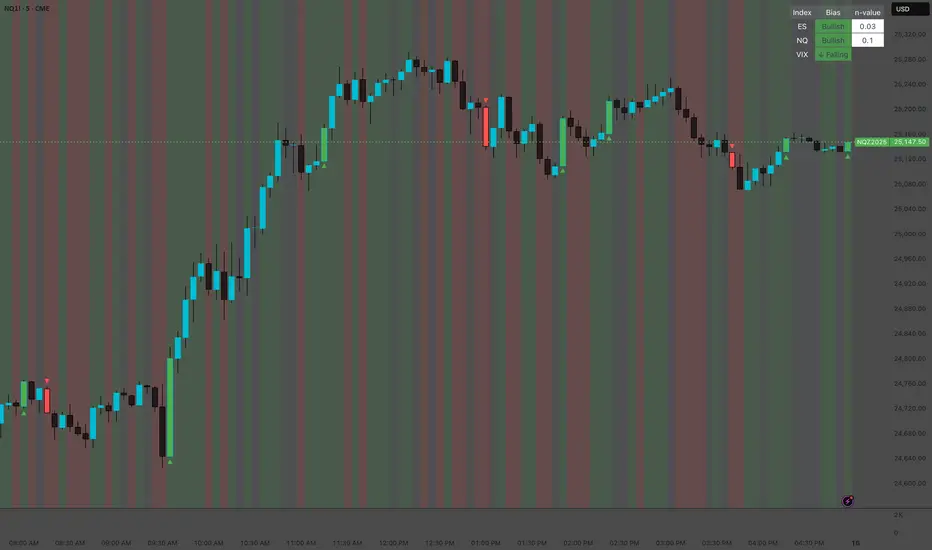
🔹 Movable Dashboard
A clean on-chart dashboard displays:
ES bias & n-value
NQ bias & n-value
VIX direction (Rising / Falling / Flat)
You can place the dashboard in any chart corner (Top-Left, Top-Right, Bottom-Left, Bottom-Right).
🔹 VIX Background Context
Optionally color the chart background automatically:
Green: Risk-On alignment
Red: Risk-Off alignment
Gray: Neutral
This provides immediate visual context behind price action.
🔹 Strong Candle Detection
The script highlights powerful bullish and bearish candles using objective criteria:
Body must exceed a minimum % of the total range
Close must occur near the session extreme
Automatically marks strong candles with up/down triangles
Optionally colors the candle bar for added clarity
Alerts also fire when a strong candle aligns with Risk-On or Risk-Off sentiment.
🔹 Alert System
Built-in alerts cover:
Risk-On alignment
Risk-Off alignment
Neutral/Out-of-alignment context
Strong Bull/Bear Candle + Sentiment alignment
High-trend n-value signals for ES and NQ
All alerts use clear descriptions for automated strategy integration.
📌 Summary
This tool provides a complete multi-asset sentiment engine by combining:
ES & NQ directional bias
VIX volatility pressure
Normalized trend strength
Strong candle confirmation
Visual dashboard
Automated alerts
It is built to support traders who rely on intermarket context, trend strength, and high-confluence entries. Release Notes
🆕 Update: Added Normalized Trend Strength (n-Value)
This update introduces a Normalized Trend Strength metric, displayed as a small numeric value next to each trend signal. It measures how strong the current trend is relative to market volatility.
How It Works
The n-value uses the difference between the Fast EMA and Slow EMA, divided by ATR:
n = | Fast EMA – Slow EMA | ÷ ATR
This transforms raw price movement into a volatility-adjusted trend strength score, making it easier to compare trend quality across different market conditions.
How to Read the n-Value
n-Value Meaning
< 0.10 No trend / Chop / Noise
0.10 – 0.30 Weak trend
0.30 – 0.60 Moderate trend
0.60 – 1.00 Strong trend
1.00+ Very strong momentum
Why It Matters
This addition helps you:
Filter weak signals
Confirm when a trend has real strength
Avoid low-quality setups
Spot strong momentum early
The n-value works automatically with your existing Fast/Slow EMA trend logic and appears inline with the trend label so you can evaluate signals at a glance.
This toolkit provides a full market-sentiment dashboard by comparing S&P 500 (ES), Nasdaq 100 (NQ), and VIX behavior in real time. It is designed to quickly identify when conditions align into Risk-On, Risk-Off, or Neutral market states and to highlight high-conviction candles that support trend continuation.
🔹 Core Logic
The script evaluates:
ES & NQ Candle Bias
Each index is classified as Bullish, Bearish, or Neutral based on its current candle (close vs open).
VIX Direction
Rising VIX = Risk-Off pressure
Falling VIX = Risk-On relief
Market Sentiment Alignment
Risk-On: ES Bullish + NQ Bullish + VIX Falling
Risk-Off: ES Bearish + NQ Bearish + VIX Rising
Neutral: Anything not aligned
🔹 Normalized Trend Strength (n-value)
The indicator introduces a normalized trend metric for both ES and NQ:
Uses fast and slow EMAs to measure directional strength
Normalizes the EMA distance by ATR
Produces an n-value that shows trend intensity regardless of volatility regime
Alerts trigger when the trend reaches a configurable strength range
This helps identify when either index is entering a strong trend environment.
🔹 Movable Dashboard
A clean on-chart dashboard displays:
ES bias & n-value
NQ bias & n-value
VIX direction (Rising / Falling / Flat)
You can place the dashboard in any chart corner (Top-Left, Top-Right, Bottom-Left, Bottom-Right).
🔹 VIX Background Context
Optionally color the chart background automatically:
Green: Risk-On alignment
Red: Risk-Off alignment
Gray: Neutral
This provides immediate visual context behind price action.
🔹 Strong Candle Detection
The script highlights powerful bullish and bearish candles using objective criteria:
Body must exceed a minimum % of the total range
Close must occur near the session extreme
Automatically marks strong candles with up/down triangles
Optionally colors the candle bar for added clarity
Alerts also fire when a strong candle aligns with Risk-On or Risk-Off sentiment.
🔹 Alert System
Built-in alerts cover:
Risk-On alignment
Risk-Off alignment
Neutral/Out-of-alignment context
Strong Bull/Bear Candle + Sentiment alignment
High-trend n-value signals for ES and NQ
All alerts use clear descriptions for automated strategy integration.
📌 Summary
This tool provides a complete multi-asset sentiment engine by combining:
ES & NQ directional bias
VIX volatility pressure
Normalized trend strength
Strong candle confirmation
Visual dashboard
Automated alerts
It is built to support traders who rely on intermarket context, trend strength, and high-confluence entries. Release Notes
🆕 Update: Added Normalized Trend Strength (n-Value)
This update introduces a Normalized Trend Strength metric, displayed as a small numeric value next to each trend signal. It measures how strong the current trend is relative to market volatility.
How It Works
The n-value uses the difference between the Fast EMA and Slow EMA, divided by ATR:
n = | Fast EMA – Slow EMA | ÷ ATR
This transforms raw price movement into a volatility-adjusted trend strength score, making it easier to compare trend quality across different market conditions.
How to Read the n-Value
n-Value Meaning
< 0.10 No trend / Chop / Noise
0.10 – 0.30 Weak trend
0.30 – 0.60 Moderate trend
0.60 – 1.00 Strong trend
1.00+ Very strong momentum
Why It Matters
This addition helps you:
Filter weak signals
Confirm when a trend has real strength
Avoid low-quality setups
Spot strong momentum early
The n-value works automatically with your existing Fast/Slow EMA trend logic and appears inline with the trend label so you can evaluate signals at a glance.
Open-source Skript
Ganz im Sinne von TradingView hat dieser Autor sein/ihr Script als Open-Source veröffentlicht. Auf diese Weise können nun auch andere Trader das Script rezensieren und die Funktionalität überprüfen. Vielen Dank an den Autor! Sie können das Script kostenlos verwenden, aber eine Wiederveröffentlichung des Codes unterliegt unseren Hausregeln.
Haftungsausschluss
Die Informationen und Veröffentlichungen sind nicht als Finanz-, Anlage-, Handels- oder andere Arten von Ratschlägen oder Empfehlungen gedacht, die von TradingView bereitgestellt oder gebilligt werden, und stellen diese nicht dar. Lesen Sie mehr in den Nutzungsbedingungen.