OPEN-SOURCE SCRIPT
% Above 50 DMA
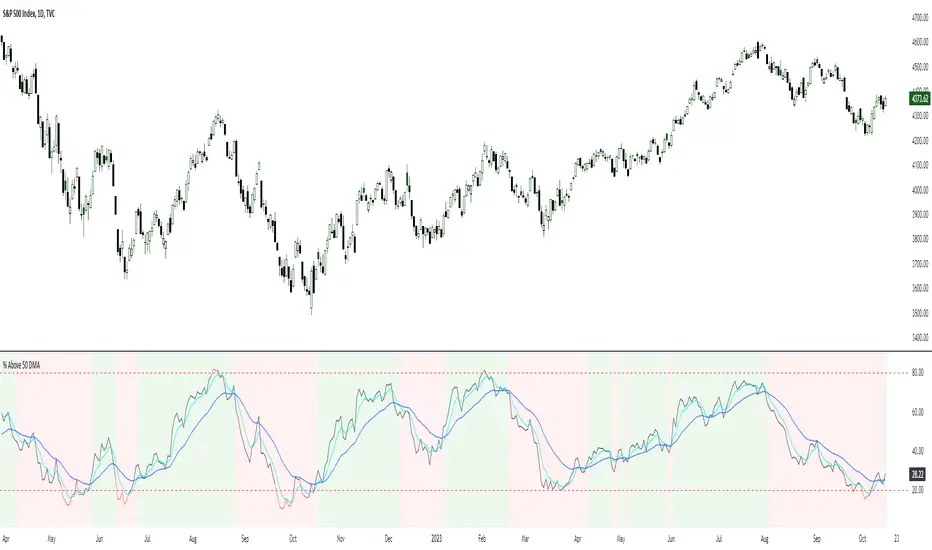
Displays the % of stocks above their 50 day average and the 5 and 20 ema of the indicator. Often the market will trend up when the 5ema is above the 20ema for this indicator, or down when vice versa. The 20% and 80% levels are plotted to show potentially oversold or overbought markets. Select NYSE or Nasdaq in the settings.
Open-source Skript
Ganz im Sinne von TradingView hat dieser Autor sein/ihr Script als Open-Source veröffentlicht. Auf diese Weise können nun auch andere Trader das Script rezensieren und die Funktionalität überprüfen. Vielen Dank an den Autor! Sie können das Script kostenlos verwenden, aber eine Wiederveröffentlichung des Codes unterliegt unseren Hausregeln.
Haftungsausschluss
Die Informationen und Veröffentlichungen sind nicht als Finanz-, Anlage-, Handels- oder andere Arten von Ratschlägen oder Empfehlungen gedacht, die von TradingView bereitgestellt oder gebilligt werden, und stellen diese nicht dar. Lesen Sie mehr in den Nutzungsbedingungen.