OPEN-SOURCE SCRIPT
probability_of_touch
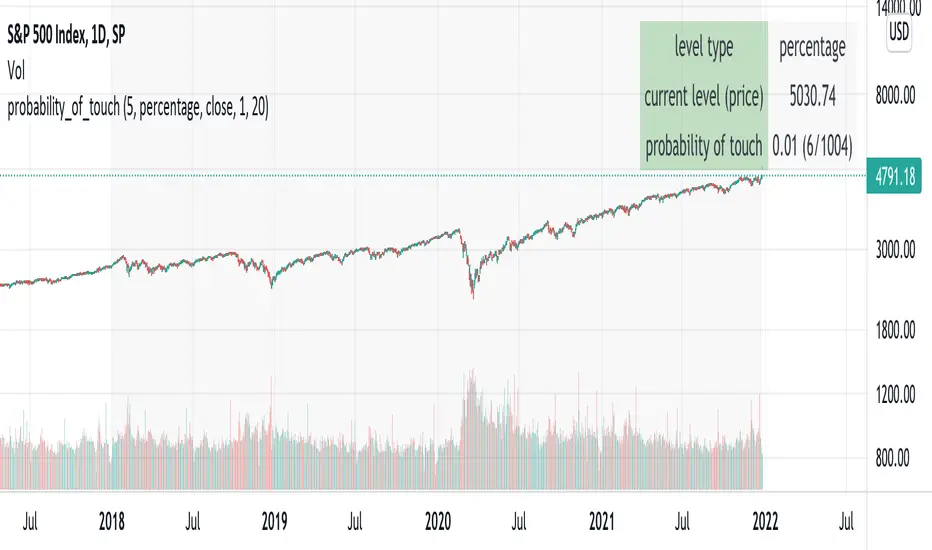
Based on historical data (rather than theory), calculates the probability of a price level being "touched" within a given time frame. A "touch" means that price exceeded that level at some point. The parameters are:
- level: the "level" to be touched. it can be a number of points, percentage points, or standard deviations away from the mark price. a positive level is above the mark price, and a negative level is below the mark price.
- type: determines the meaning of the "level" parameter. "price" means price points (i.e. the numbers you see on the chart). "percentage" is expressed as a whole number, not a fraction. "stdev" means number of standard deviations, which is computed from recent realized volatlity.
- mark: the point from which the "level" is measured.
- length: the number of days within which the level must be touched.
- window: the number of days used to compute realized volatility. this parameter is only used when "type" is "stdev".
- debug: displays a fuchsia "X" over periods that touched the level. note that only a limited number of labels can be drawn.
- start: only include data after this time in the calculation.
- end: only include data before this time in the calculation.
Example: You want to know how many times Apple stock fell $1 from its closing price the next day, between 2020-02-26 and today. Use the following parameters:
level: -1
type: price
mark: close
length: 1
window: [NA]
debug: [NA]
start: 2020-02-26
end: [default]
How does the script work? On every bar, the script looks back "length" days and sees if any day exceeded the "mark" price from "length" days ago, plus the limit. The probability is the ratio of such periods wherein price exceeded the limit to the total number of periods.
Open-source Skript
Ganz im Sinne von TradingView hat dieser Autor sein/ihr Script als Open-Source veröffentlicht. Auf diese Weise können nun auch andere Trader das Script rezensieren und die Funktionalität überprüfen. Vielen Dank an den Autor! Sie können das Script kostenlos verwenden, aber eine Wiederveröffentlichung des Codes unterliegt unseren Hausregeln.
Haftungsausschluss
Die Informationen und Veröffentlichungen sind nicht als Finanz-, Anlage-, Handels- oder andere Arten von Ratschlägen oder Empfehlungen gedacht, die von TradingView bereitgestellt oder gebilligt werden, und stellen diese nicht dar. Lesen Sie mehr in den Nutzungsbedingungen.