OPEN-SOURCE SCRIPT
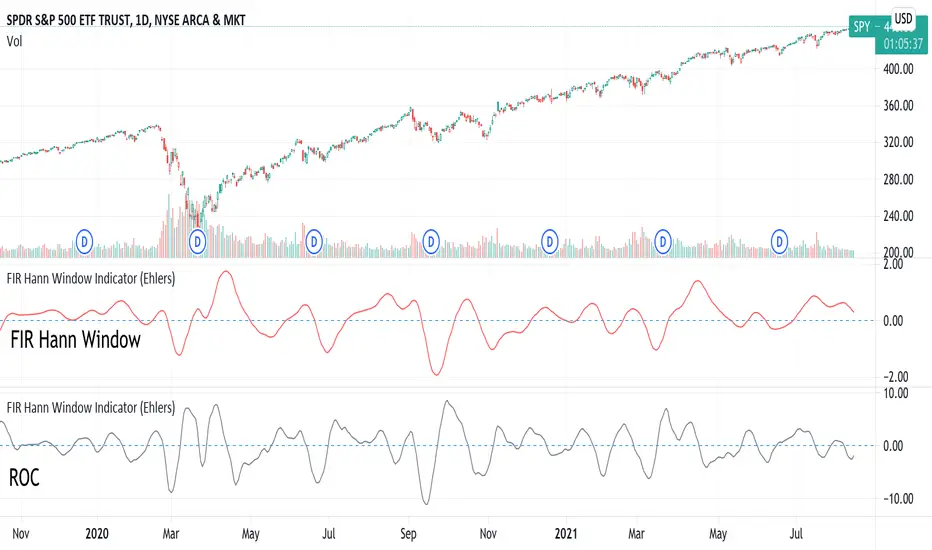
FIR Hann Window Indicator (Ehlers)
From Ehlers' Windowing article:
"A still-smoother weighting function that is easy to program is called the Hann window. The Hann window is often described as a “sine squared” distribution, although it is easier to program as a cosine subtracted from unity. The shape of the coefficient outline looks like a sinewave whose valleys are at the ends of the array and whose peak is at the center of the array. This configuration offers a smooth window transition from the smallest coefficient amplitude to the largest coefficient amplitude."
Ported from: { TASC SEP 2021 FIR Hann Window Indicator } (C) 2021 John F. Ehlers
Stocks & Commodities V. 39:09 (8–14, 23): Windowing by John F. Ehlers
Original code found here: traders.com/Documentation/FEEDbk_docs/2021/09/TradersTips.html
FIR Chart: traders.com/Documentation/FEEDbk_docs/2021/09/images/TT-Tradestation1.gif
ROC Chart: traders.com/Documentation/FEEDbk_docs/2021/09/images/TT-Tradestation1.gif
Ehlers style implementation mostly maintained for easy verification.
Added optional ROC display.
Style and efficiency updates + Hann windowing as a function coming soon.
Indicator added twice to chart show both FIR and ROC.
Open-source Skript
Ganz im Sinne von TradingView hat dieser Autor sein/ihr Script als Open-Source veröffentlicht. Auf diese Weise können nun auch andere Trader das Script rezensieren und die Funktionalität überprüfen. Vielen Dank an den Autor! Sie können das Script kostenlos verwenden, aber eine Wiederveröffentlichung des Codes unterliegt unseren Hausregeln.
Haftungsausschluss
Die Informationen und Veröffentlichungen sind nicht als Finanz-, Anlage-, Handels- oder andere Arten von Ratschlägen oder Empfehlungen gedacht, die von TradingView bereitgestellt oder gebilligt werden, und stellen diese nicht dar. Lesen Sie mehr in den Nutzungsbedingungen.