OPEN-SOURCE SCRIPT
QQE MT4
QQE (Quantative Qualitative Estimation) MT4 Version by Roman Ignatov
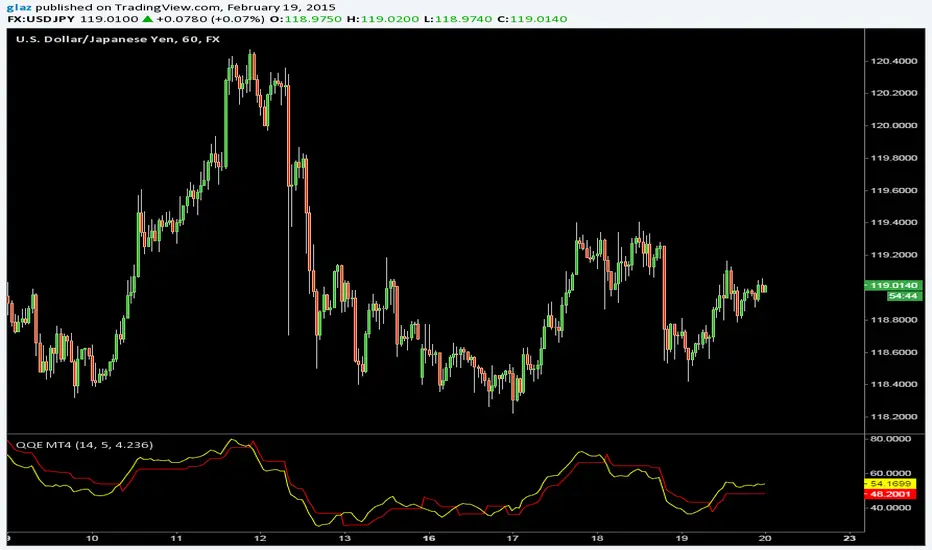
Another indicator from MT4 to pinescript, from a google search i found the that the original author is unknown and its best used for volatile pairs /JPY
yellow line is a smoothed rsi,
red line "slow trailing stop" is the ATR smoothing with a 14-periods wilders smoothing function that is multiplied by a factor of 4.236
Also big thanks to BlindFreddy, i used part of his supertrend indicator to make it work
Open-source Skript
Ganz im Sinne von TradingView hat dieser Autor sein/ihr Script als Open-Source veröffentlicht. Auf diese Weise können nun auch andere Trader das Script rezensieren und die Funktionalität überprüfen. Vielen Dank an den Autor! Sie können das Script kostenlos verwenden, aber eine Wiederveröffentlichung des Codes unterliegt unseren Hausregeln.
Haftungsausschluss
Die Informationen und Veröffentlichungen sind nicht als Finanz-, Anlage-, Handels- oder andere Arten von Ratschlägen oder Empfehlungen gedacht, die von TradingView bereitgestellt oder gebilligt werden, und stellen diese nicht dar. Lesen Sie mehr in den Nutzungsbedingungen.