OPEN-SOURCE SCRIPT
User Defined Range Selector and Color Changing EMA Line
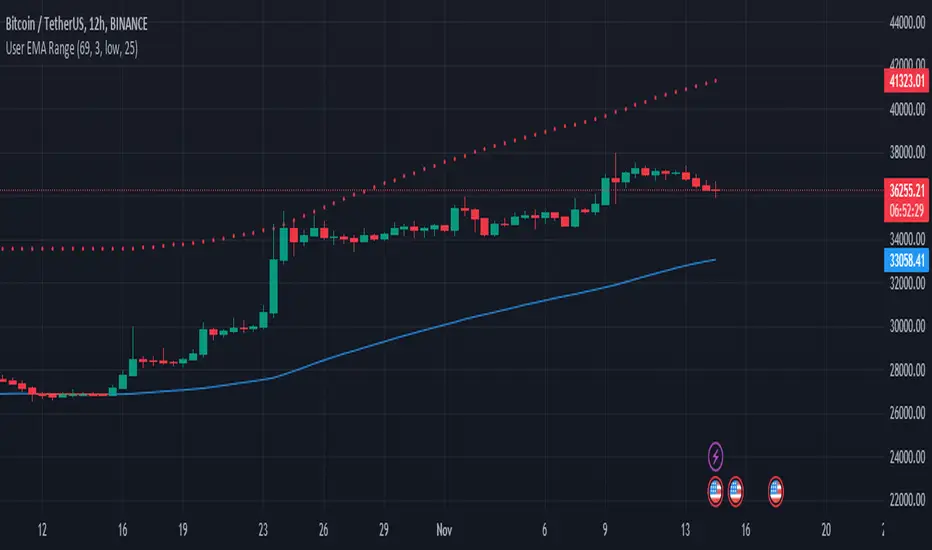
The "User Defined Range Selector and Color Changing EMA Line," stands out in the crowded field of trading indicators due to its unique blend of visual clarity and customizable functionality. Unlike traditional indicators, this tool not only tracks the Exponential Moving Average (EMA) but enhances it with a user-defined mirrored line to visually denote a range based on a percentage distance from the EMA.
Key Features:
- Dynamic Color-Changing EMA: The EMA line changes color based on its slope, providing instant visual cues about the market trend. Blue signifies an upward trend, red indicates a downward trend, and gray represents a sideways market.
- Customizable Range Selector: A mirrored EMA line is plotted, which can be set at a user-defined percentage away from the primary EMA. This feature allows traders to visualize a potential price range or channel, adding an extra layer of analysis for potential support and resistance zones.
- User-Driven Inputs: With inputs like EMA length, slope length, source, and the percentage distance for the mirrored line, the indicator offers a high level of customization, catering to various trading styles and strategies.
- Enhanced Trading Strategy Development: This combination of trend visualization and range identification aids in refining entry and exit points, making it an invaluable tool for developing more nuanced trading strategies.
Why It's Unique:
- Dual Functionality: The combination of trend indication (via color changes) and range visualization (through the mirrored line) sets this indicator apart from traditional EMA-based tools.
- Customization and Flexibility: The ability to tailor key parameters like EMA length and the percentage away for the mirrored line empowers traders to adapt the tool to fit their specific trading approach and market conditions.
- Visual Simplicity: Despite its multifaceted capabilities, the indicator maintains a clean and intuitive visual presentation, ensuring ease of use and interpretation.
License: This source code is subject to the terms of the Mozilla Public License 2.0. More details can be found at [Mozilla Public License 2.0](mozilla.org/MPL/2.0/). However, the code is public so use it as you see fit.
Open-source Skript
Ganz im Sinne von TradingView hat dieser Autor sein/ihr Script als Open-Source veröffentlicht. Auf diese Weise können nun auch andere Trader das Script rezensieren und die Funktionalität überprüfen. Vielen Dank an den Autor! Sie können das Script kostenlos verwenden, aber eine Wiederveröffentlichung des Codes unterliegt unseren Hausregeln.
Haftungsausschluss
Die Informationen und Veröffentlichungen sind nicht als Finanz-, Anlage-, Handels- oder andere Arten von Ratschlägen oder Empfehlungen gedacht, die von TradingView bereitgestellt oder gebilligt werden, und stellen diese nicht dar. Lesen Sie mehr in den Nutzungsbedingungen.