OPEN-SOURCE SCRIPT
FT-RSI
Summary of the Custom RSI Indicator Script (For Futu Niuniu Platform):
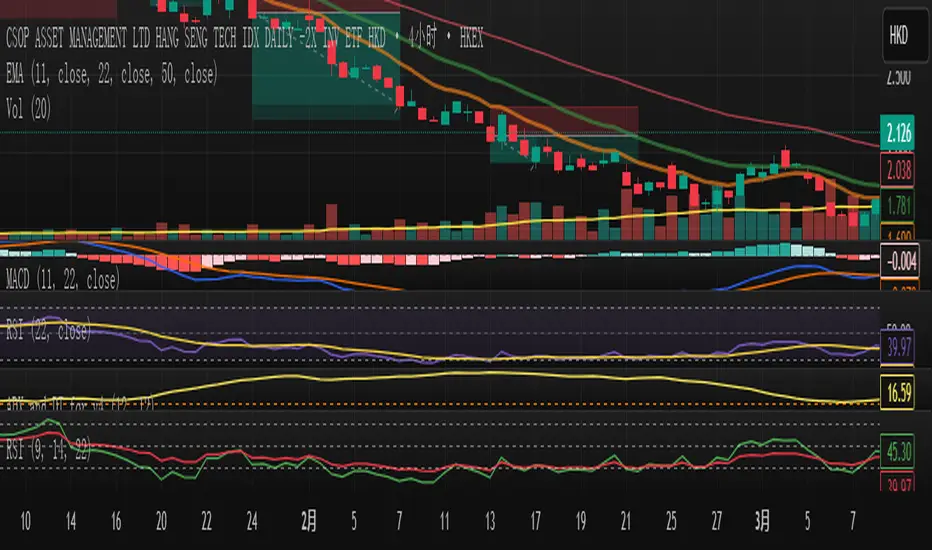
This Pine Script code implements a triple-period RSI indicator with horizontal reference lines (70, 50, 30) for technical analysis on the Futu Niuniu trading platform.
Key Features:
Multi-period RSI Calculation:
Computes three RSI values using 9, 14, and 22-period lengths to capture short-term, standard, and smoothed momentum signals.
Utilizes the Relative Moving Average (RMA) method for RSI calculation (ta.rma function).
Horizontal Reference Bands:
Upper Band (70): Red dotted line (semi-transparent) to identify overbought conditions.
Middle Band (50): Green dotted line as the neutral equilibrium level.
Lower Band (30): Blue dotted line (semi-transparent) to highlight oversold zones.
Visual Customization:
Distinct colors for each RSI line:
RSI (9): Orange (#F79A00)
RSI (14): Green (#49B50D)
RSI (22): Blue (#5188FF)
All lines have a thickness of 2 pixels for clear visibility.
Platform Compatibility:
This script is designed for Futu Niuniu’s charting system, leveraging Pine Script syntax adaptations supported by the platform. The horizontal bands and multi-period RSI logic help traders analyze trend strength and potential reversal points efficiently.
Note: Ensure Futu Niuniu’s scripting environment supports ta.rma and hline functions for proper execution.
Open-source Skript
Ganz im Sinne von TradingView hat dieser Autor sein/ihr Script als Open-Source veröffentlicht. Auf diese Weise können nun auch andere Trader das Script rezensieren und die Funktionalität überprüfen. Vielen Dank an den Autor! Sie können das Script kostenlos verwenden, aber eine Wiederveröffentlichung des Codes unterliegt unseren Hausregeln.
Haftungsausschluss
Die Informationen und Veröffentlichungen sind nicht als Finanz-, Anlage-, Handels- oder andere Arten von Ratschlägen oder Empfehlungen gedacht, die von TradingView bereitgestellt oder gebilligt werden, und stellen diese nicht dar. Lesen Sie mehr in den Nutzungsbedingungen.