OPEN-SOURCE SCRIPT
Waves of Wealth Pair Trading Ratio
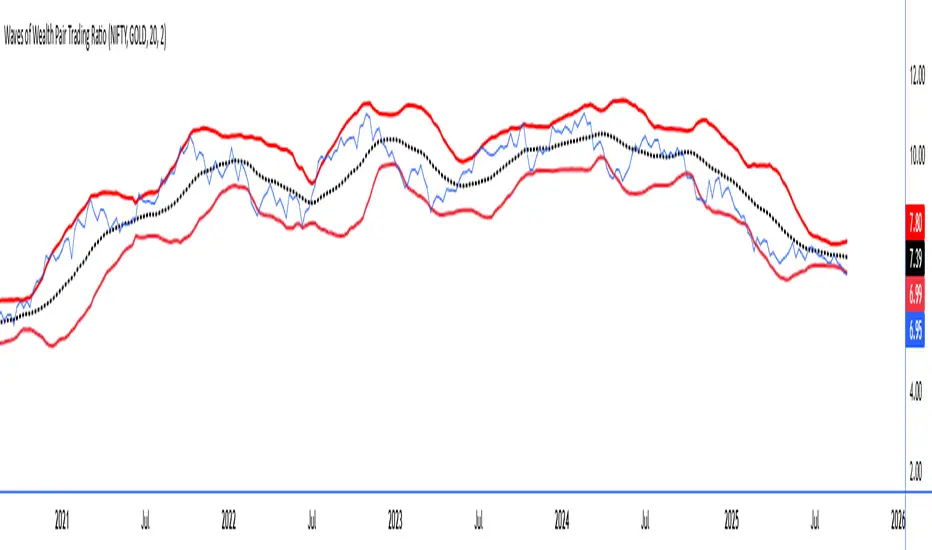
This versatile indicator dynamically plots the ratio between two user-selected instruments, helping traders visualize relative performance and detect potential mean-reversion or trend continuation opportunities.
Features include:
User inputs for selecting any two instrument symbols for comparison.
Adjustable moving average period to track the average ratio over time.
Customizable standard deviation multiplier to define statistical bands for overbought and oversold conditions.
Visual display of the ratio line alongside upper and lower bands for clear trading signals.
Ideal for pair traders and market analysts seeking a flexible tool to monitor inter-asset relationships and exploit deviations from historical norms.
Simply set your preferred symbols and parameters to tailor the indicator to your trading style and assets of interest.
How to Use the Custom Pair Trading Ratio Indicator
Select symbols: Use the indicator inputs to set any two instruments you want to compare—stocks, commodities, ETFs, or indices. No coding needed, just type or select from the dropdown.
Adjust parameters: Customize the moving average length to suit your trading timeframe and style. The standard deviation multiplier lets you control sensitivity—higher values mean wider bands, capturing only larger deviations.
Interpret the chart:
The ratio line shows relative strength between the two instruments.
The middle line represents the average ratio (mean).
The upper and lower bands indicate statistical extremes where price action is usually overextended.
Trading signals:
Look to enter pair trades when the ratio moves outside the bands—expecting a return to the mean.
Use the bands and mean to set stop-loss and profit targets.
Combine with other analysis or fundamental insight for best results.
Open-source Skript
Ganz im Sinne von TradingView hat dieser Autor sein/ihr Script als Open-Source veröffentlicht. Auf diese Weise können nun auch andere Trader das Script rezensieren und die Funktionalität überprüfen. Vielen Dank an den Autor! Sie können das Script kostenlos verwenden, aber eine Wiederveröffentlichung des Codes unterliegt unseren Hausregeln.
Dev Advisory
Haftungsausschluss
Die Informationen und Veröffentlichungen sind nicht als Finanz-, Anlage-, Handels- oder andere Arten von Ratschlägen oder Empfehlungen gedacht, die von TradingView bereitgestellt oder gebilligt werden, und stellen diese nicht dar. Lesen Sie mehr in den Nutzungsbedingungen.