OPEN-SOURCE SCRIPT
Double Moving Average
█ OVERVIEW
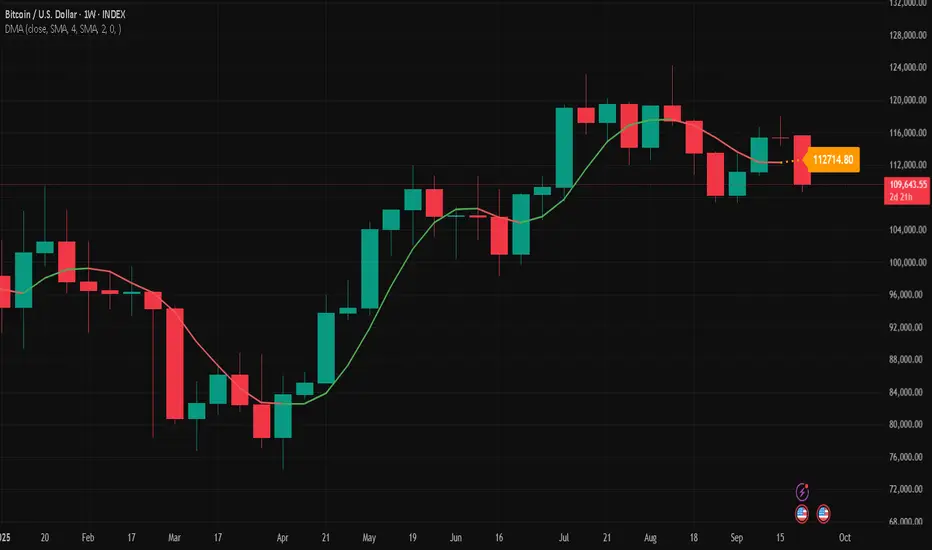
The Double Moving Average (DMA) smooths one moving average with a second moving average.
Includes moving average type, higher timeframe, offset, alerts, and style settings for all of the indicator's visual components. This indicator includes an optional line and label to indicate the latest value of the DMA that repaints.
█ CONCEPTS
Shorter term moving averages, especially in choppy markets, can rapidly increase and decrease their slope. Which could lead some traders into assuming that the series trend may continue at that steeper slope. By smoothing a moving average with another one, the magnitude of rapid choppy movements is mitigated.

█ FEATURES
DMA Customization
Most inputs have a tooltip that can be read by interacting with the information icon to guide users.

For both moving averages in the DMA, users can set the lookback length and moving average type independently. Available moving average types include:
A bar offset setting is included for shifting the indicator's placement. Using different lookback combinations for both averages alongside an offset can create equivalent values of other types of moving averages not included in this indicator. For example, if the default lookback settings are offset by 1 bar, this duplicates a 4 period centered moving average.

Colors for the DMA's plot can toggle between a single "base" color, or using increasing and decreasing colors. Changing the plot's style, line style, and width is also supported.

Latest Value Line and Label
The latest value of the DMA plot is replaced by default with a feature called the Latest Value Line and Label: a stylized line and label to help indicate the part of the indicator that can repaint from the parts that don't repaint. Data used to draw this feature is calculated separately from the indicator's confirmed historical calculations.

A label is included to display the latest value of the DMA which includes complete style settings. The style of both the line and label are completely customizable; every style feature that can be included has a corresponding input you can set.
Toggling off the Latest Value Line and Label feature will cause all the respective style inputs to deactivate so that they're no longer in focus or editable until the feature is toggled on again.

Higher Timeframes
Users can plot the DMA from higher timeframes on their chart.
As new bars print, the non-repainting DMA historical plot uses the last confirmed higher timeframe value. The repainting Latest Value Line and Label will update with the most recent higher timeframe value only for the latest bar. If the Latest Value Line feature is toggled off, the last confirmed higher timeframe DMA value is plotted up to the latest bar.

The built-in Moving Average Simple (SMA) indicator includes several of the features in this indicator, like an option for using higher timeframe. However, by default, it plots no values except on bars with higher timeframe close updates. Disabling "Wait for timeframe closes" to get values between updates causes repainting in both replay mode and realtime bars.
Since the calculations that repaint are separate and optional in the DMA indicator, historical plotted values will not repaint in replay mode or on realtime bars while using higher timeframes.

Alerts
There are two DMA value options when creating an alert:
The default alert option is DMA Latest because most users expect alerts when the price crosses the latest updating DMA value. The Last Confirmed Value alert option uses the DMA value from the latest confirmed historical bar.

When creating an alert you should see a "Caution!" warning saying, "This is due to calculations being based on an indicator or strategy that can get repainted." This warning is intentional because the DMA indicator's Latest Value Line and Label feature is supposed to repaint in order to display the latest value.
█ FOR Pine Script™ CODERS
The Double Moving Average (DMA) smooths one moving average with a second moving average.
Includes moving average type, higher timeframe, offset, alerts, and style settings for all of the indicator's visual components. This indicator includes an optional line and label to indicate the latest value of the DMA that repaints.
█ CONCEPTS
Shorter term moving averages, especially in choppy markets, can rapidly increase and decrease their slope. Which could lead some traders into assuming that the series trend may continue at that steeper slope. By smoothing a moving average with another one, the magnitude of rapid choppy movements is mitigated.
█ FEATURES
DMA Customization
Most inputs have a tooltip that can be read by interacting with the information icon to guide users.
For both moving averages in the DMA, users can set the lookback length and moving average type independently. Available moving average types include:
- Simple Moving Average
- Exponential Moving Average
- Hull Moving Average
- Weighted Moving Average
- Volume Weighted Moving Average
A bar offset setting is included for shifting the indicator's placement. Using different lookback combinations for both averages alongside an offset can create equivalent values of other types of moving averages not included in this indicator. For example, if the default lookback settings are offset by 1 bar, this duplicates a 4 period centered moving average.
Colors for the DMA's plot can toggle between a single "base" color, or using increasing and decreasing colors. Changing the plot's style, line style, and width is also supported.
Latest Value Line and Label
The latest value of the DMA plot is replaced by default with a feature called the Latest Value Line and Label: a stylized line and label to help indicate the part of the indicator that can repaint from the parts that don't repaint. Data used to draw this feature is calculated separately from the indicator's confirmed historical calculations.
A label is included to display the latest value of the DMA which includes complete style settings. The style of both the line and label are completely customizable; every style feature that can be included has a corresponding input you can set.
Toggling off the Latest Value Line and Label feature will cause all the respective style inputs to deactivate so that they're no longer in focus or editable until the feature is toggled on again.
Higher Timeframes
Users can plot the DMA from higher timeframes on their chart.
As new bars print, the non-repainting DMA historical plot uses the last confirmed higher timeframe value. The repainting Latest Value Line and Label will update with the most recent higher timeframe value only for the latest bar. If the Latest Value Line feature is toggled off, the last confirmed higher timeframe DMA value is plotted up to the latest bar.
The built-in Moving Average Simple (SMA) indicator includes several of the features in this indicator, like an option for using higher timeframe. However, by default, it plots no values except on bars with higher timeframe close updates. Disabling "Wait for timeframe closes" to get values between updates causes repainting in both replay mode and realtime bars.
Since the calculations that repaint are separate and optional in the DMA indicator, historical plotted values will not repaint in replay mode or on realtime bars while using higher timeframes.
Alerts
There are two DMA value options when creating an alert:
- DMA Latest Value: Use the latest updating DMA Value. The same value as the Latest Value Line.
- DMA Last Confirmed Value: Use the last historical closed DMA value.
The default alert option is DMA Latest because most users expect alerts when the price crosses the latest updating DMA value. The Last Confirmed Value alert option uses the DMA value from the latest confirmed historical bar.
When creating an alert you should see a "Caution!" warning saying, "This is due to calculations being based on an indicator or strategy that can get repainted." This warning is intentional because the DMA indicator's Latest Value Line and Label feature is supposed to repaint in order to display the latest value.
█ FOR Pine Script™ CODERS
- StyleLibrary is used to create user-friendly plot, line, and label style enum type inputs. The library's functions then take those user inputs and convert them into the appropriate values/built-in constants to customize styles for plot, line, and label functions.
- Titles for #region blocks are included after #endregion statements for clarity when multiple #endregion statements occur.
- This indicator utilizes the new active parameter for style inputs of togglable features.
Open-source Skript
Ganz im Sinne von TradingView hat dieser Autor sein/ihr Script als Open-Source veröffentlicht. Auf diese Weise können nun auch andere Trader das Script rezensieren und die Funktionalität überprüfen. Vielen Dank an den Autor! Sie können das Script kostenlos verwenden, aber eine Wiederveröffentlichung des Codes unterliegt unseren Hausregeln.
Joe Baus, bausbenchmarks.com
Haftungsausschluss
Die Informationen und Veröffentlichungen sind nicht als Finanz-, Anlage-, Handels- oder andere Arten von Ratschlägen oder Empfehlungen gedacht, die von TradingView bereitgestellt oder gebilligt werden, und stellen diese nicht dar. Lesen Sie mehr in den Nutzungsbedingungen.