OPEN-SOURCE SCRIPT
Bias Dashboard + All Open Lines (M/W/D/H4/H1/15min)
What does the script do?
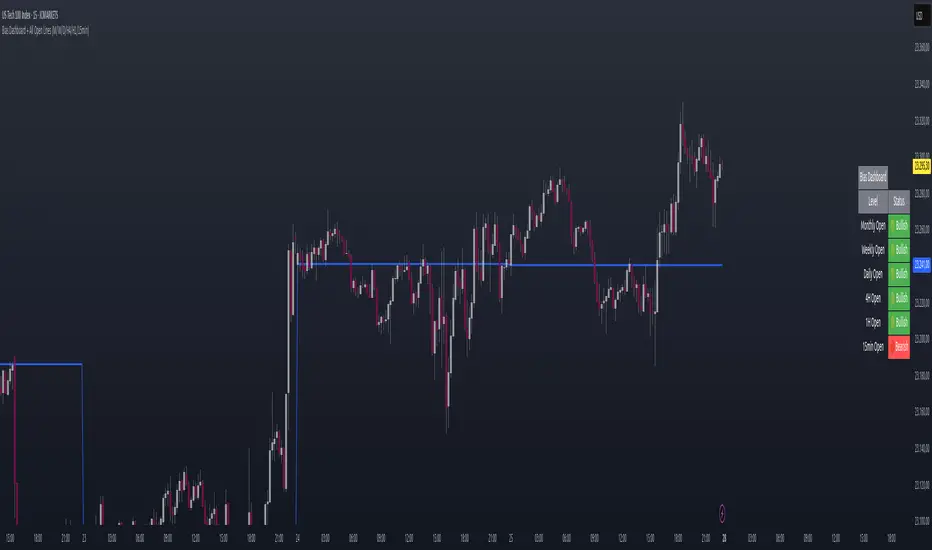
This script displays a dashboard that shows the current market bias relative to the open prices of multiple timeframes:
Monthly
Weekly
Daily
4H
1H
15min
Additionally, it plots horizontal lines at each of these open levels on the chart.
How it works
Fetch Open Prices:
The script uses request.security() to get the open prices for each timeframe.
Determine Bias:
Compares the current close price to each open:
If close > open, then "Bullish"
If close < open, then "Bearish"
Display Dashboard:
A visual dashboard shows:
The timeframe label
Whether the current price is above (bullish) or below (bearish) that level
Plot Lines:
Colored horizontal lines are drawn on the chart to indicate each timeframe’s open level.
Open-source Skript
Ganz im Sinne von TradingView hat dieser Autor sein/ihr Script als Open-Source veröffentlicht. Auf diese Weise können nun auch andere Trader das Script rezensieren und die Funktionalität überprüfen. Vielen Dank an den Autor! Sie können das Script kostenlos verwenden, aber eine Wiederveröffentlichung des Codes unterliegt unseren Hausregeln.
Haftungsausschluss
Die Informationen und Veröffentlichungen sind nicht als Finanz-, Anlage-, Handels- oder andere Arten von Ratschlägen oder Empfehlungen gedacht, die von TradingView bereitgestellt oder gebilligt werden, und stellen diese nicht dar. Lesen Sie mehr in den Nutzungsbedingungen.