OPEN-SOURCE SCRIPT
Moving Avareges Cross
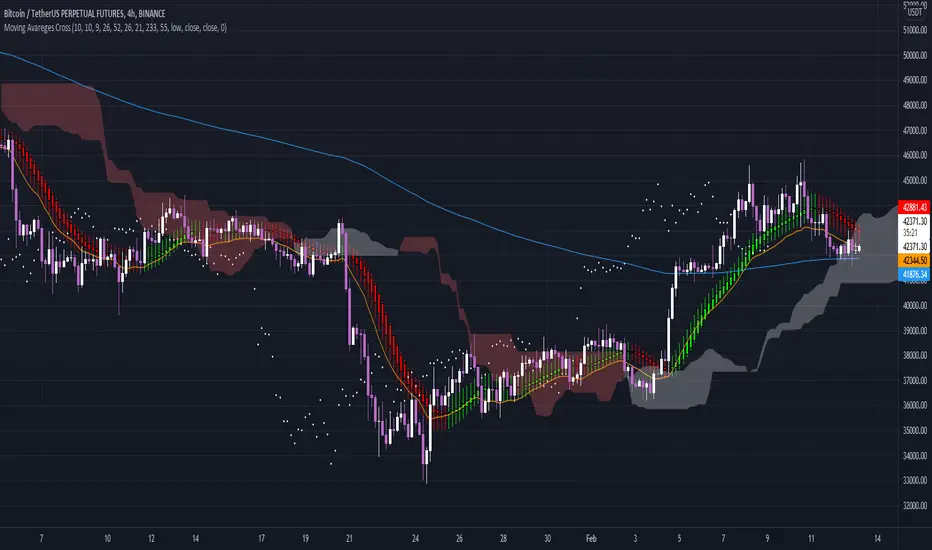
In this script I have combined 3 indicators Ichimoku, Heiken Ashi and Moving Average Exponential.
In this strategy, you should first look for the current market trend in low time frames.
Then look at the higher time frames to decide if you are in the right place to enter the trade.
For example, in 1 minute time frame, we first look at whether the two averages 21 and 233 had a cross or not.
If the moving average of 21 crosses the moving average of 233 from the bottom up and the end of the line moves the moving average of 233 upwards, it can be concluded
The market trend in time frame has changed for 1 minute and is up.
Then we refer to the time frames of 3, 5 and 15 minutes and check the same conditions there.
If 3 of the 4 time frames have the same conditions, we use Heiken Ashi to check the strength of the wave that is formed.
And also by looking at Ichimoku we will see where this Kumo cloud formed this wave.
If these conditions are met, a serious decision can be made to enter the position.
Higher time frames such as 30 minutes or 1 hour and 4 hours can also be used to find important resistance and support pivots.
In this way, the average of 233 and 21 and the formation of the current candlestick give us an acceptable range for fluctuation.
Open-source Skript
Ganz im Sinne von TradingView hat dieser Autor sein/ihr Script als Open-Source veröffentlicht. Auf diese Weise können nun auch andere Trader das Script rezensieren und die Funktionalität überprüfen. Vielen Dank an den Autor! Sie können das Script kostenlos verwenden, aber eine Wiederveröffentlichung des Codes unterliegt unseren Hausregeln.
Haftungsausschluss
Die Informationen und Veröffentlichungen sind nicht als Finanz-, Anlage-, Handels- oder andere Arten von Ratschlägen oder Empfehlungen gedacht, die von TradingView bereitgestellt oder gebilligt werden, und stellen diese nicht dar. Lesen Sie mehr in den Nutzungsbedingungen.