OPEN-SOURCE SCRIPT
Large Body Candle Indicator
Functionality
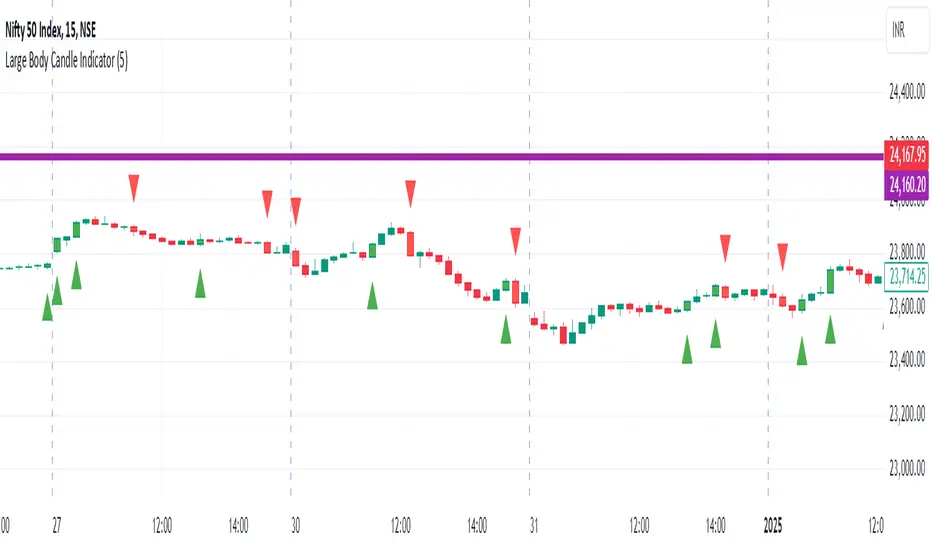
Comparison: The indicator compares the body size of the current candle to the maximum body size of the previous 5 candles.
Bullish Candles: When a bullish candle (close > open) has a larger body than the previous 5 candles:
A green triangle is plotted below the candle
The candle is colored green
Bearish Candles: When a bearish candle (close < open) has a larger body than the previous 5
candles:
A red triangle is plotted above the candle
The candle is colored red
Key Components
Lookback Period: Default set to 5 candles, but can be adjusted by the user.
Body Size Calculation: Calculated as the absolute difference between the open and close prices.
Maximum Previous Body Size: Determined by comparing the body sizes of the previous 5 candles.
Candle Classification: Candles are classified as bullish or bearish based on the relationship between open and close prices.
Visual Indicators:
Shape plotting for triangles
Bar coloring for highlighted candles
User Customization
Users can adjust the lookback period through the indicator settings, allowing for flexibility in identifying significant candles based on recent price action.
Use Cases
Identifying potential breakout candles
Spotting significant price movements
Enhancing visual analysis of price action
Supporting decision-making in trading strategies
Limitations
The indicator does not predict future price movements
It's based solely on recent price action and doesn't consider other technical or fundamental factors
Conclusion
The Large Body Candle Indicator provides a simple yet effective way to visually identify candles that show significant price movement relative to recent price action. It can be a valuable tool when used in conjunction with other technical analysis methods.
Open-source Skript
Ganz im Sinne von TradingView hat dieser Autor sein/ihr Script als Open-Source veröffentlicht. Auf diese Weise können nun auch andere Trader das Script rezensieren und die Funktionalität überprüfen. Vielen Dank an den Autor! Sie können das Script kostenlos verwenden, aber eine Wiederveröffentlichung des Codes unterliegt unseren Hausregeln.
Haftungsausschluss
Die Informationen und Veröffentlichungen sind nicht als Finanz-, Anlage-, Handels- oder andere Arten von Ratschlägen oder Empfehlungen gedacht, die von TradingView bereitgestellt oder gebilligt werden, und stellen diese nicht dar. Lesen Sie mehr in den Nutzungsbedingungen.