OPEN-SOURCE SCRIPT
Aktualisiert Bullseye PDHL
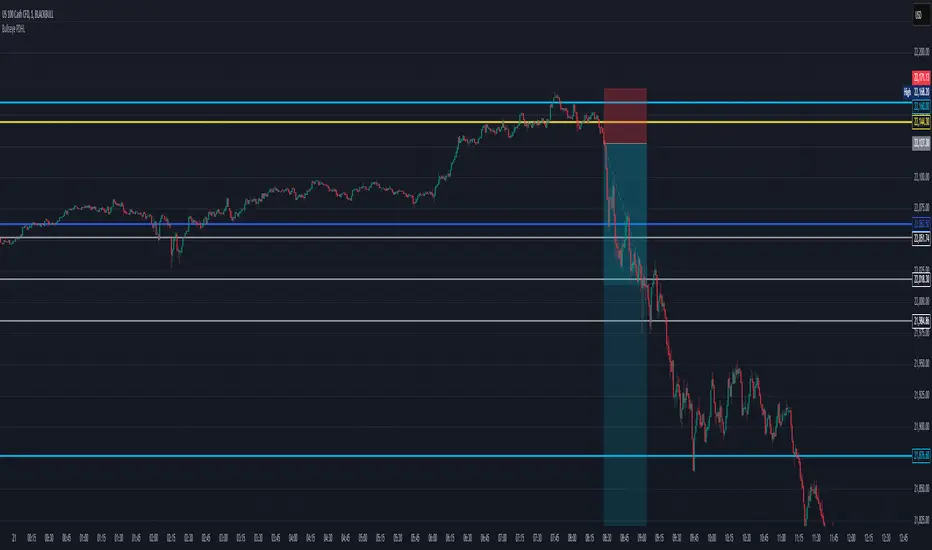
Bullseye PDHL Indicator
The Bullseye PDHL indicator is designed for traders who want to visually identify key price levels from the previous trading day, including the high, low, and significant Fibonacci retracement levels. This indicator helps traders understand potential support and resistance zones, which can be useful for planning entries and exits.
Key Features:
Previous Day’s High and Low:
Plots the previous day’s high and low as solid lines on the chart to easily identify important levels from the prior session.
These levels serve as critical support and resistance markers, which are often respected by the market.
Fibonacci Retracement Levels:
Plots three Fibonacci retracement levels (38.2%, 50%, and 61.8%) between the previous day’s high and low.
These levels are key reference points for assessing potential pullbacks or retracements during the current trading day.
Visual Representation:
The previous day’s high and low are plotted in cyan for easy differentiation.
The Fibonacci retracement levels (30%, 50%, 60%) are plotted in white, providing a clear visual reference for traders.
This indicator can help traders identify important reaction zones and areas where price might reverse or consolidate, making it a valuable addition for technical analysis.
Versionshinweise
Cool Update to Bullseye PDHL on TradingView!Hey traders! 🚀 Check out the latest tweak to the Bullseye PDHL indicator—it's now got neat switches to show or hide yesterday's open and close prices right on your charts. Customize your view, keep your charts slick, and make analyzing those price moves easier than ever! Jump into your next trade with style with the new Bullseye PDHL!
Open-source Skript
Ganz im Sinne von TradingView hat dieser Autor sein/ihr Script als Open-Source veröffentlicht. Auf diese Weise können nun auch andere Trader das Script rezensieren und die Funktionalität überprüfen. Vielen Dank an den Autor! Sie können das Script kostenlos verwenden, aber eine Wiederveröffentlichung des Codes unterliegt unseren Hausregeln.
Haftungsausschluss
Die Informationen und Veröffentlichungen sind nicht als Finanz-, Anlage-, Handels- oder andere Arten von Ratschlägen oder Empfehlungen gedacht, die von TradingView bereitgestellt oder gebilligt werden, und stellen diese nicht dar. Lesen Sie mehr in den Nutzungsbedingungen.