OPEN-SOURCE SCRIPT
Aktualisiert Spider Vision
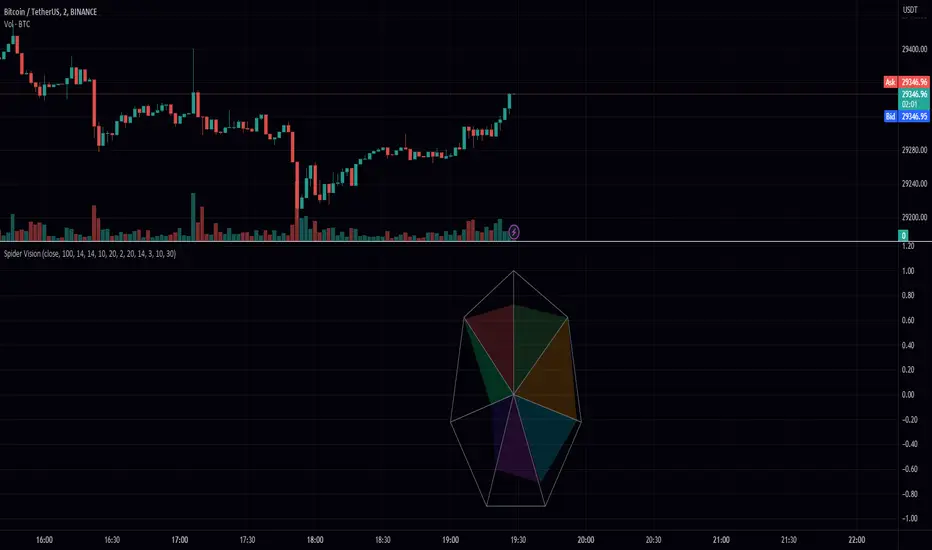
Spider Vision is an indicator that I created for trading view, which consists of a spider chart with 7 indicators built into it. This chart provides a visual representation of how these indicators are behaving, allowing traders to quickly assess the current market conditions.
The chart displays the following indicators:
RSI (Relative Strength Index): This is a momentum indicator that measures the strength of a security's price action. When the RSI is above 70, it is considered overbought, and when it is below 30, it is considered oversold.
Stochastic: This is another momentum indicator that compares the closing price of a security to its price range over a given time period. When the stochastic is above 80, it is considered overbought, and when it is below 20, it is considered oversold.
Momentum: This is a simple indicator that measures the change in a security's price over a given time period. When the momentum is positive, it indicates that the price is increasing, and when it is negative, it indicates that the price is decreasing.
BBW (Bollinger Bands Width): This indicator measures the width of the Bollinger Bands, which are a popular technical analysis tool used to identify potential trends and reversals. When the BBW is high, it suggests that the market is volatile, and when it is low, it suggests that the market is quiet.
DTO (Detrended Price Oscillator): This indicator measures the difference between the price of a security and its moving average. When the DTO is positive, it indicates that the price is above its moving average, and when it is negative, it indicates that the price is below its moving average.
Chop Zone: This indicator measures the choppiness of the market by comparing the average true range (ATR) to the difference between the high and low prices over a given time period. When the chop zone is high, it suggests that the market is choppy, and when it is low, it suggests that the market is trending.
Chaikin Oscillator: This is an oscillator that measures the accumulation/distribution of a security. When the Chaikin Oscillator is positive, it indicates that there is buying pressure in the market, and when it is negative, it indicates that there is selling pressure.
To use this indicator, traders can simply add it to their TradingView chart and adjust the input parameters to suit their trading style. The scale parameter can be used to adjust the size of the spider chart, while the color parameters can be used to customize the appearance of the chart. Traders can also adjust the length of each indicator to suit their preference.
Overall, the Spider Vision indicator provides a convenient way for traders to quickly assess the current market conditions and make more informed trading decisions.
Versionshinweise
chop zone didnt need normalization Open-source Skript
Ganz im Sinne von TradingView hat dieser Autor sein/ihr Script als Open-Source veröffentlicht. Auf diese Weise können nun auch andere Trader das Script rezensieren und die Funktionalität überprüfen. Vielen Dank an den Autor! Sie können das Script kostenlos verwenden, aber eine Wiederveröffentlichung des Codes unterliegt unseren Hausregeln.
Haftungsausschluss
Die Informationen und Veröffentlichungen sind nicht als Finanz-, Anlage-, Handels- oder andere Arten von Ratschlägen oder Empfehlungen gedacht, die von TradingView bereitgestellt oder gebilligt werden, und stellen diese nicht dar. Lesen Sie mehr in den Nutzungsbedingungen.
Open-source Skript
Ganz im Sinne von TradingView hat dieser Autor sein/ihr Script als Open-Source veröffentlicht. Auf diese Weise können nun auch andere Trader das Script rezensieren und die Funktionalität überprüfen. Vielen Dank an den Autor! Sie können das Script kostenlos verwenden, aber eine Wiederveröffentlichung des Codes unterliegt unseren Hausregeln.
Haftungsausschluss
Die Informationen und Veröffentlichungen sind nicht als Finanz-, Anlage-, Handels- oder andere Arten von Ratschlägen oder Empfehlungen gedacht, die von TradingView bereitgestellt oder gebilligt werden, und stellen diese nicht dar. Lesen Sie mehr in den Nutzungsbedingungen.