OPEN-SOURCE SCRIPT
Volume change [ Unlimited ]
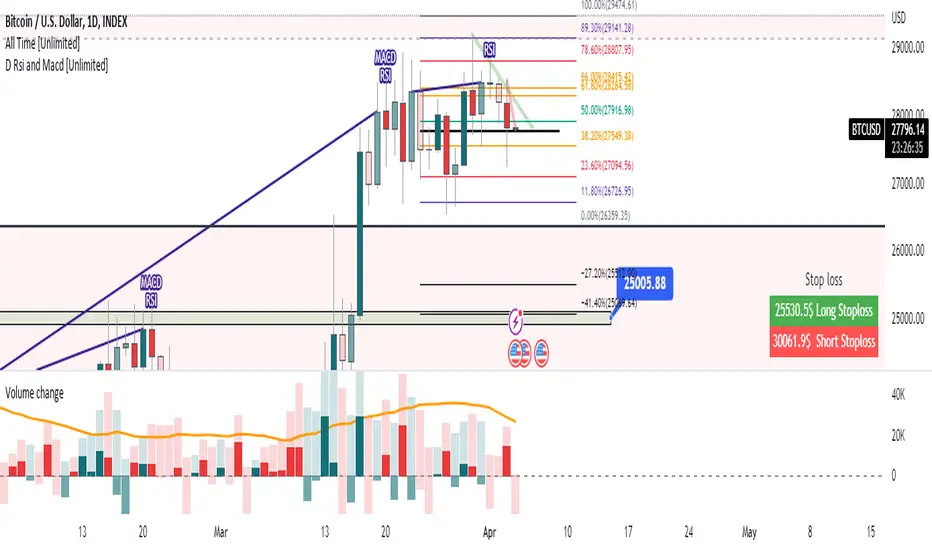
This indicator displays volume and volume change information on a chart. It is designed to help traders analyze changes in trading volume over time and identify potential trading opportunities.
The indicator takes an input from the user to set the length of the exponential moving average (EMA) applied to the volume data. This EMA is used to smooth out short-term fluctuations in volume and highlight the overall trend in volume.
The indicator calculates whether the current bar is up or down and calculates the change in volume. It then sets the color of the volume and volume change columns based on whether the bar is up or down and whether the volume change is positive or negative.
By displaying this information on a chart, the indicator can help traders identify patterns or trends in volume and volume change that may indicate potential trading opportunities. For example, increasing volume along with rising prices could indicate strong buying pressure and a potential bullish trend, while decreasing volume along with falling prices could indicate weak selling pressure and a potential bearish trend.
Open-source Skript
Ganz im Sinne von TradingView hat dieser Autor sein/ihr Script als Open-Source veröffentlicht. Auf diese Weise können nun auch andere Trader das Script rezensieren und die Funktionalität überprüfen. Vielen Dank an den Autor! Sie können das Script kostenlos verwenden, aber eine Wiederveröffentlichung des Codes unterliegt unseren Hausregeln.
Haftungsausschluss
Die Informationen und Veröffentlichungen sind nicht als Finanz-, Anlage-, Handels- oder andere Arten von Ratschlägen oder Empfehlungen gedacht, die von TradingView bereitgestellt oder gebilligt werden, und stellen diese nicht dar. Lesen Sie mehr in den Nutzungsbedingungen.