OPEN-SOURCE SCRIPT
Aktualisiert Dual timeframe calculated candles
A script example to show how you can calculate the value of certain indicators from a higher timeframe at the moment that a bar closes on a shorter timeframe.
In this example the base chart is set to 5 mins and the multiplier is set to 6, so the HTF arrays hold data equivalent to that from the 30 minute chart which will hopefully appear below it on this display.
Each time a 5 minute bar completes, the arrays are updated by checking whether a new high or low has been set. The values for the HTF ATR and EMA are also updated by removing the most recent value from that array and replacing it with the value that would have been calculated based on the close at that time. As such for back testing purposes you'd know exactly what the 30 min chart would have been showing you at any one of the 5 minute intervals. Useful for backtesting strategies if you would rather act on the "up to the minute" HTF data, rather than the HTF data from the last HTF close, which could be significantly delayed if you're using a high enough multiplier.
Versionshinweise
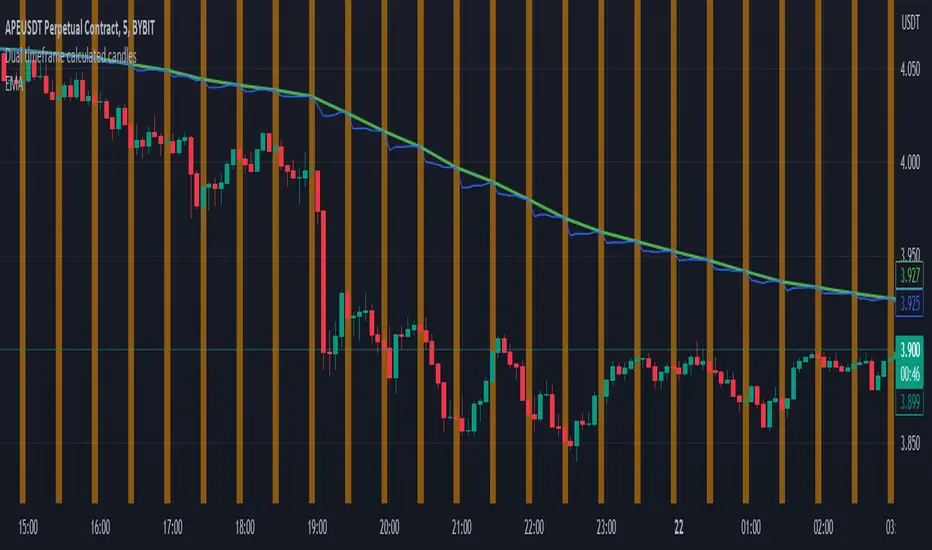
Chart update for clarity. Green line is the EMA function applied to the chart with its timeframe set to 30 mins. As you'll see it coincides with the values the script calculates every 6 bars, but between those times the calculated EMA differs as the close from each 5 min candle would change the most up to date HTF line as well.Versionshinweise
Removed the option of setting how many HTF bars to keep. If this was set to a value less than the EMA length, then the HTF EMA never initialised properly.It's probably not needed to trim the arrays for memory purposes, but just in case the arrays are now trimmed to 110% of the emaLength (plus 2 more for good measure).
Open-source Skript
Ganz im Sinne von TradingView hat dieser Autor sein/ihr Script als Open-Source veröffentlicht. Auf diese Weise können nun auch andere Trader das Script rezensieren und die Funktionalität überprüfen. Vielen Dank an den Autor! Sie können das Script kostenlos verwenden, aber eine Wiederveröffentlichung des Codes unterliegt unseren Hausregeln.
Haftungsausschluss
Die Informationen und Veröffentlichungen sind nicht als Finanz-, Anlage-, Handels- oder andere Arten von Ratschlägen oder Empfehlungen gedacht, die von TradingView bereitgestellt oder gebilligt werden, und stellen diese nicht dar. Lesen Sie mehr in den Nutzungsbedingungen.