OPEN-SOURCE SCRIPT
Aktualisiert KJS-- Gost Pivot MA
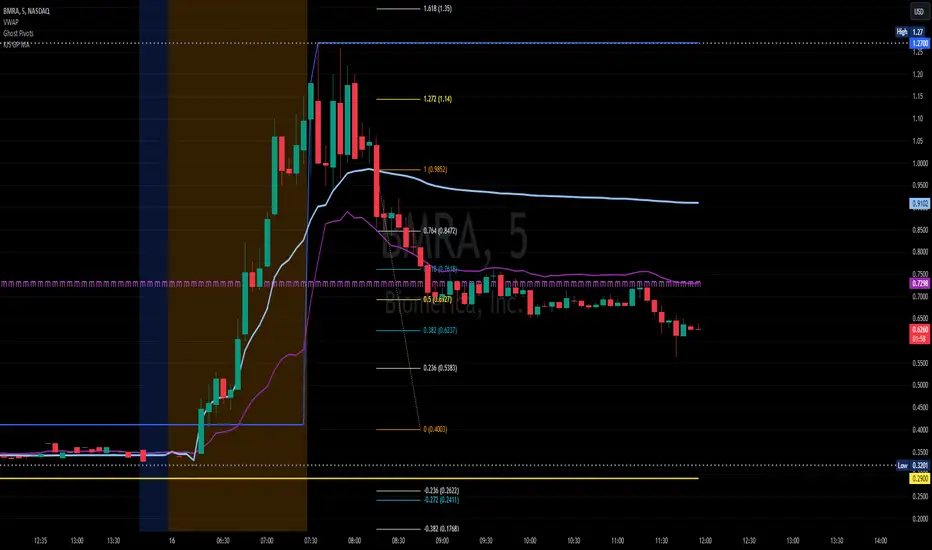
KJS Ghost Pivot Moving Average
This indicator calculates a "Ghost Pivot" by estimating where the monthly pivot level would be if the current candle's close represented the end of the month. The calculation uses:
• The current month's high and low from regular trading hours (RTH).
• The current candle's close, which includes both premarket and after-hours data.
It also smooths the ghost pivot using a customizable simple moving average (SMA).
Features:
• Plots the current month's high (blue) and low (yellow) based on RTH data.
• Calculates and plots a dynamic pivot (purple line) as the average of the monthly high, low, and current close (HLC3).
• Includes a customizable SMA length for smoother pivot tracking (default: 3).
This indicator helps traders anticipate potential monthly pivot levels in real-time while visualizing key support and resistance areas.
Versionshinweise
KJS Ghost Pivot Moving AverageThis indicator calculates a “Ghost Pivot" by estimating where the monthly pivot level would be if the current candle’s close represented the end of the month. The calculation uses:
It also smooths the ghost pivot using a customizable simple moving average (SMA).
Features:
This indicator helps traders anticipate potential monthly pivot levels in real-time while visualizing key support and resistance areas.
Versionshinweise
Update to Pine Script v6Open-source Skript
Ganz im Sinne von TradingView hat dieser Autor sein/ihr Script als Open-Source veröffentlicht. Auf diese Weise können nun auch andere Trader das Script rezensieren und die Funktionalität überprüfen. Vielen Dank an den Autor! Sie können das Script kostenlos verwenden, aber eine Wiederveröffentlichung des Codes unterliegt unseren Hausregeln.
Haftungsausschluss
Die Informationen und Veröffentlichungen sind nicht als Finanz-, Anlage-, Handels- oder andere Arten von Ratschlägen oder Empfehlungen gedacht, die von TradingView bereitgestellt oder gebilligt werden, und stellen diese nicht dar. Lesen Sie mehr in den Nutzungsbedingungen.
Open-source Skript
Ganz im Sinne von TradingView hat dieser Autor sein/ihr Script als Open-Source veröffentlicht. Auf diese Weise können nun auch andere Trader das Script rezensieren und die Funktionalität überprüfen. Vielen Dank an den Autor! Sie können das Script kostenlos verwenden, aber eine Wiederveröffentlichung des Codes unterliegt unseren Hausregeln.
Haftungsausschluss
Die Informationen und Veröffentlichungen sind nicht als Finanz-, Anlage-, Handels- oder andere Arten von Ratschlägen oder Empfehlungen gedacht, die von TradingView bereitgestellt oder gebilligt werden, und stellen diese nicht dar. Lesen Sie mehr in den Nutzungsbedingungen.