OPEN-SOURCE SCRIPT
90-Day Beta to BTC
Overview:
The 90-Day Beta to BTC indicator measures the volatility of a specific token relative to Bitcoin (BTC) over the past 90 days. Beta is a widely used statistical measure in financial markets that indicates how much a token's price moves in relation to BTC. A higher beta means the token is more volatile compared to BTC, while a lower beta means it is less volatile or moves similarly to BTC.
How It Works:
This indicator calculates the daily logarithmic returns of both the token and Bitcoin, then computes the covariance between their returns and the variance of Bitcoin’s returns. The resulting Beta value reflects the degree to which the token’s price fluctuates relative to Bitcoin's price over the past 90 days.
Beta > 1: The token is more volatile than Bitcoin, showing higher price swings.
Beta = 1: The token moves in lockstep with Bitcoin, exhibiting similar volatility.
Beta < 1: The token is less volatile than Bitcoin, showing smaller price fluctuations.
Beta = 0: The token's price movement is uncorrelated with Bitcoin’s price.
Negative Beta: The token moves opposite to Bitcoin, indicating an inverse relationship.
Use Case:
This indicator is particularly useful for traders or investors looking to identify tokens with high speculative volatility. Tokens with Beta values above 1 are typically high-risk, high-reward assets, often driven by hype, social trends, or market speculation. Conversely, tokens with Beta values below 1 offer a more stable price relationship with Bitcoin, making them less volatile and potentially safer.
In the context of a Trash Token Tournament, tokens with a higher Beta (greater than 1) may be more attractive due to their heightened volatility and potential for larger price swings, making them the “wild cards” of the market.
Visual Representation:
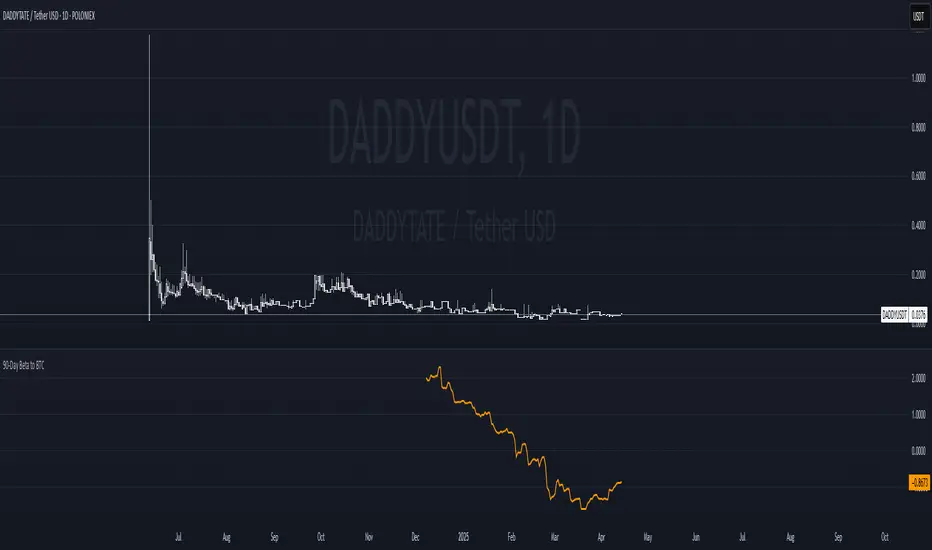
The Beta value is plotted as a line chart beneath the main price chart, offering a visual representation of the token’s volatility relative to Bitcoin over the last 90 days. Spikes in Beta indicate periods of increased volatility, while drops suggest stability.
The 90-Day Beta to BTC indicator measures the volatility of a specific token relative to Bitcoin (BTC) over the past 90 days. Beta is a widely used statistical measure in financial markets that indicates how much a token's price moves in relation to BTC. A higher beta means the token is more volatile compared to BTC, while a lower beta means it is less volatile or moves similarly to BTC.
How It Works:
This indicator calculates the daily logarithmic returns of both the token and Bitcoin, then computes the covariance between their returns and the variance of Bitcoin’s returns. The resulting Beta value reflects the degree to which the token’s price fluctuates relative to Bitcoin's price over the past 90 days.
Beta > 1: The token is more volatile than Bitcoin, showing higher price swings.
Beta = 1: The token moves in lockstep with Bitcoin, exhibiting similar volatility.
Beta < 1: The token is less volatile than Bitcoin, showing smaller price fluctuations.
Beta = 0: The token's price movement is uncorrelated with Bitcoin’s price.
Negative Beta: The token moves opposite to Bitcoin, indicating an inverse relationship.
Use Case:
This indicator is particularly useful for traders or investors looking to identify tokens with high speculative volatility. Tokens with Beta values above 1 are typically high-risk, high-reward assets, often driven by hype, social trends, or market speculation. Conversely, tokens with Beta values below 1 offer a more stable price relationship with Bitcoin, making them less volatile and potentially safer.
In the context of a Trash Token Tournament, tokens with a higher Beta (greater than 1) may be more attractive due to their heightened volatility and potential for larger price swings, making them the “wild cards” of the market.
Visual Representation:
The Beta value is plotted as a line chart beneath the main price chart, offering a visual representation of the token’s volatility relative to Bitcoin over the last 90 days. Spikes in Beta indicate periods of increased volatility, while drops suggest stability.
Open-source Skript
Ganz im Sinne von TradingView hat dieser Autor sein/ihr Script als Open-Source veröffentlicht. Auf diese Weise können nun auch andere Trader das Script rezensieren und die Funktionalität überprüfen. Vielen Dank an den Autor! Sie können das Script kostenlos verwenden, aber eine Wiederveröffentlichung des Codes unterliegt unseren Hausregeln.
Haftungsausschluss
Die Informationen und Veröffentlichungen sind nicht als Finanz-, Anlage-, Handels- oder andere Arten von Ratschlägen oder Empfehlungen gedacht, die von TradingView bereitgestellt oder gebilligt werden, und stellen diese nicht dar. Lesen Sie mehr in den Nutzungsbedingungen.