OPEN-SOURCE SCRIPT
Aktualisiert Gaussian Acceleration Array

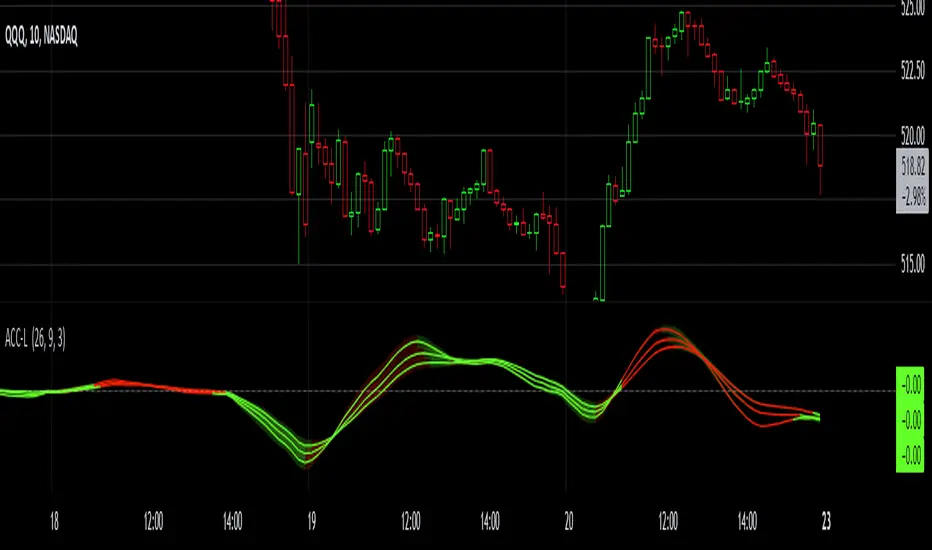
Indicators play a role in analyzing price action, trends, and potential reversals. Among many of these, velocity and acceleration have held a significant place due to their ability to provide insight into momentum and rate of change. This indicator takes the old calculation and tweaks it with gaussian smoothing and logarithmic function to ensure proper scaling.
A Brief on Velocity and Acceleration: The concept of velocity in trading refers to the speed at which price changes over time, while acceleration is the rate of change(ROC) of velocity. Early momentum indicators like the RSI and MACD laid foundation for understanding price velocity. However, as markets evolve so do we as technical analysts, we seek the most advanced tools.
The Acceleration/Deceleration Oscillator, introduced by Bill Williams, was one of the early attempts to measure acceleration. It helped gauge whether the market was gaining or losing momentum. Over time more specific tools like the "Awesome Oscillator"(AO) emerged, which has a set length on the datasets measured.
Gaussian Functions: Named after the mathematician Carl Friedrich Gauss, the Gaussian function describes a bell-shaped curve, often referred to as the "normal distribution." In trading these functions are applied to smooth data and reduce noise, focusing on underlying patterns.
The Gaussian Acceleration Array leverages this function to create a smoothed representation of market acceleration.
How does it work?
Practical Tips:
The Gaussian Acceleration Array offers various customizable parameters, including the sample period, smoothing function, and array variance. Experiment with these settings to tailor it to preferred timeframes and styles.
The color-coded lines and background zones make it easier to interpret the indicator at a glance. The backgrounds indicate increasing or decreasing momentum simply as a visual aid while the lines state how the velocity average is performing. Combining this with other tools can signal shifts in market dynamics.
A Brief on Velocity and Acceleration: The concept of velocity in trading refers to the speed at which price changes over time, while acceleration is the rate of change(ROC) of velocity. Early momentum indicators like the RSI and MACD laid foundation for understanding price velocity. However, as markets evolve so do we as technical analysts, we seek the most advanced tools.
The Acceleration/Deceleration Oscillator, introduced by Bill Williams, was one of the early attempts to measure acceleration. It helped gauge whether the market was gaining or losing momentum. Over time more specific tools like the "Awesome Oscillator"(AO) emerged, which has a set length on the datasets measured.
Gaussian Functions: Named after the mathematician Carl Friedrich Gauss, the Gaussian function describes a bell-shaped curve, often referred to as the "normal distribution." In trading these functions are applied to smooth data and reduce noise, focusing on underlying patterns.
The Gaussian Acceleration Array leverages this function to create a smoothed representation of market acceleration.
How does it work?
- This indicator calculates acceleration based the highs and lows of each dataset
- Once the weighted average for velocity is determined, its rate of change essentially becomes the acceleration
- It then plots multiple lines with customizable variance from the primary selected length
Practical Tips:
The Gaussian Acceleration Array offers various customizable parameters, including the sample period, smoothing function, and array variance. Experiment with these settings to tailor it to preferred timeframes and styles.
The color-coded lines and background zones make it easier to interpret the indicator at a glance. The backgrounds indicate increasing or decreasing momentum simply as a visual aid while the lines state how the velocity average is performing. Combining this with other tools can signal shifts in market dynamics.
Versionshinweise
Update to V6, added inversion option, and changed default colors.Versionshinweise
- Updated defaults, velocity colors set to trend following instead of reversion to centroid. Changes to colors and inversion settings available in input section.
Open-source Skript
Ganz im Sinne von TradingView hat dieser Autor sein/ihr Script als Open-Source veröffentlicht. Auf diese Weise können nun auch andere Trader das Script rezensieren und die Funktionalität überprüfen. Vielen Dank an den Autor! Sie können das Script kostenlos verwenden, aber eine Wiederveröffentlichung des Codes unterliegt unseren Hausregeln.
KP
Haftungsausschluss
Die Informationen und Veröffentlichungen sind nicht als Finanz-, Anlage-, Handels- oder andere Arten von Ratschlägen oder Empfehlungen gedacht, die von TradingView bereitgestellt oder gebilligt werden, und stellen diese nicht dar. Lesen Sie mehr in den Nutzungsbedingungen.