OPEN-SOURCE SCRIPT
Aktualisiert Heiken Ashi Lower Pane
Not one of my more challenging scripts, never the less I was requested to publish this open source indicator.
Heiken Ashi (HA) candles indicate strength usually when the candles have wicks in the direction of the movement, ie. top wicks on green candles w/NO wicks on bottom and vice versa for bearish behavior (bottom wicks on red candles). Weakness in the movement CAN be spotted by watching for wicks opposite the movement appearing.
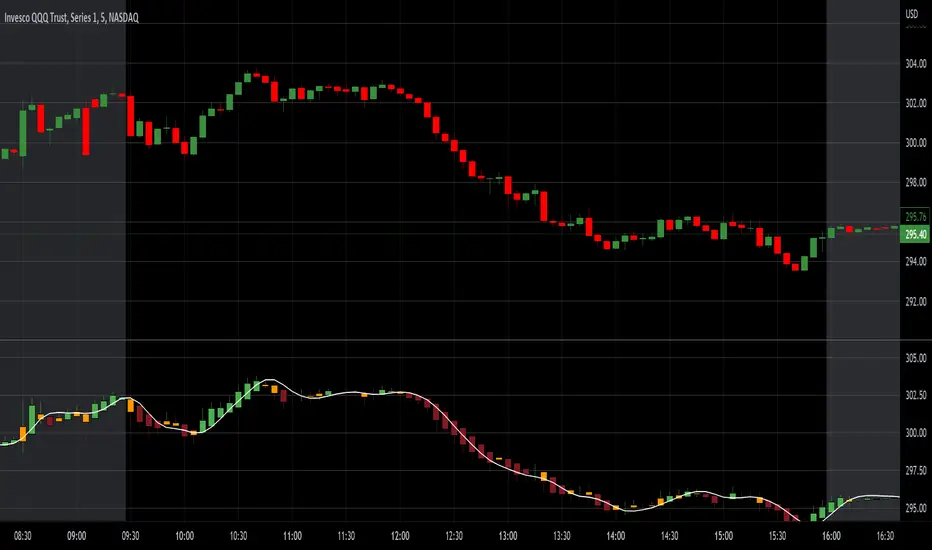
This indicator can be used in a lower pane to show heiken ashi candles concurrently with above main chart regular candles.
Nothing special about it other than displaying bull/bear ha candles with a twist of third color candle (orange default) which is shown when HA candle gets a wick in opposite direction of movement which usually indicates potential directional weakness.
It also provides various moving average line types based upon the HA high, low, close, open values (HLC4) that can used if you are into watching for a cross over of the HA candle to a MA line.
Note: You can also display this over the main chart as an overlay just by selecting the three dots on the indicator and "Move to" option. Be advised doing so will probably cause too much overlapping onto the regular candles.
Heiken Ashi (HA) candles indicate strength usually when the candles have wicks in the direction of the movement, ie. top wicks on green candles w/NO wicks on bottom and vice versa for bearish behavior (bottom wicks on red candles). Weakness in the movement CAN be spotted by watching for wicks opposite the movement appearing.
This indicator can be used in a lower pane to show heiken ashi candles concurrently with above main chart regular candles.
Nothing special about it other than displaying bull/bear ha candles with a twist of third color candle (orange default) which is shown when HA candle gets a wick in opposite direction of movement which usually indicates potential directional weakness.
It also provides various moving average line types based upon the HA high, low, close, open values (HLC4) that can used if you are into watching for a cross over of the HA candle to a MA line.
Note: You can also display this over the main chart as an overlay just by selecting the three dots on the indicator and "Move to" option. Be advised doing so will probably cause too much overlapping onto the regular candles.
Versionshinweise
Fixed Bugs regarding timeframes and added multi time frame options.Open-source Skript
Ganz im Sinne von TradingView hat dieser Autor sein/ihr Script als Open-Source veröffentlicht. Auf diese Weise können nun auch andere Trader das Script rezensieren und die Funktionalität überprüfen. Vielen Dank an den Autor! Sie können das Script kostenlos verwenden, aber eine Wiederveröffentlichung des Codes unterliegt unseren Hausregeln.
Haftungsausschluss
Die Informationen und Veröffentlichungen sind nicht als Finanz-, Anlage-, Handels- oder andere Arten von Ratschlägen oder Empfehlungen gedacht, die von TradingView bereitgestellt oder gebilligt werden, und stellen diese nicht dar. Lesen Sie mehr in den Nutzungsbedingungen.
Open-source Skript
Ganz im Sinne von TradingView hat dieser Autor sein/ihr Script als Open-Source veröffentlicht. Auf diese Weise können nun auch andere Trader das Script rezensieren und die Funktionalität überprüfen. Vielen Dank an den Autor! Sie können das Script kostenlos verwenden, aber eine Wiederveröffentlichung des Codes unterliegt unseren Hausregeln.
Haftungsausschluss
Die Informationen und Veröffentlichungen sind nicht als Finanz-, Anlage-, Handels- oder andere Arten von Ratschlägen oder Empfehlungen gedacht, die von TradingView bereitgestellt oder gebilligt werden, und stellen diese nicht dar. Lesen Sie mehr in den Nutzungsbedingungen.