OPEN-SOURCE SCRIPT
PowerXYZ Strategy (PowerX Modified)
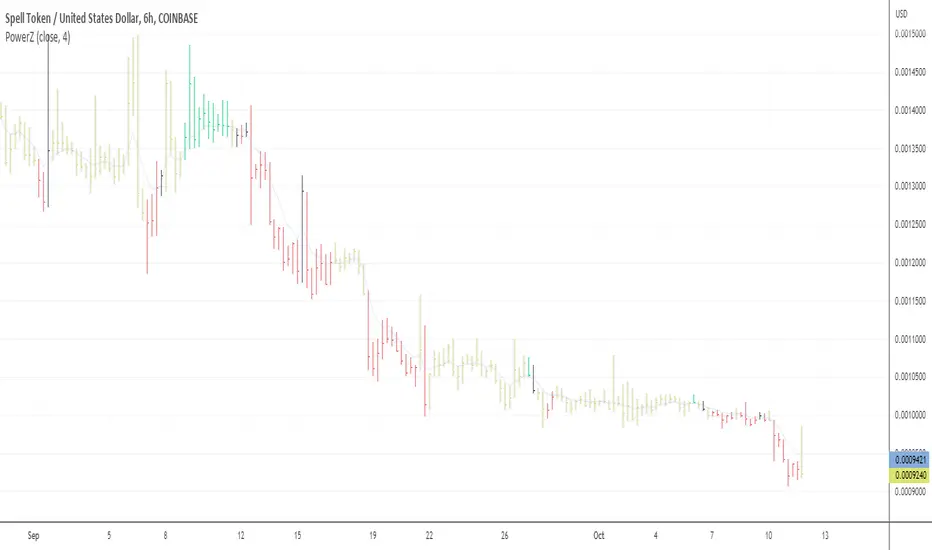
This script modifies the PowerX strategy in the following ways:
- there are two types of 'black' bars, yellow and black; the bars that are colored black indicate the flip of the RSI from positive to negative, and vise versa, while the signal is also near to green or red color; the close of these bars are a strong indication of support or resistance, and the previous closes behind these bars create S&D zones.
- compares the typical price to the 4-period smoothed moving average to generate yellow bars sooner at the end of trends.
- uses a signal line of > 49 and <= 49 instead of 50.
Yellow indicates that you should probably move your stop closer to the current price.
Black indicates that you should probably exit and look for a new entry, as it is a strong area of support or resistance.
Open-source Skript
Ganz im Sinne von TradingView hat dieser Autor sein/ihr Script als Open-Source veröffentlicht. Auf diese Weise können nun auch andere Trader das Script rezensieren und die Funktionalität überprüfen. Vielen Dank an den Autor! Sie können das Script kostenlos verwenden, aber eine Wiederveröffentlichung des Codes unterliegt unseren Hausregeln.
Haftungsausschluss
Die Informationen und Veröffentlichungen sind nicht als Finanz-, Anlage-, Handels- oder andere Arten von Ratschlägen oder Empfehlungen gedacht, die von TradingView bereitgestellt oder gebilligt werden, und stellen diese nicht dar. Lesen Sie mehr in den Nutzungsbedingungen.