OPEN-SOURCE SCRIPT
Aktualisiert Large volume indicator to show the price above/below
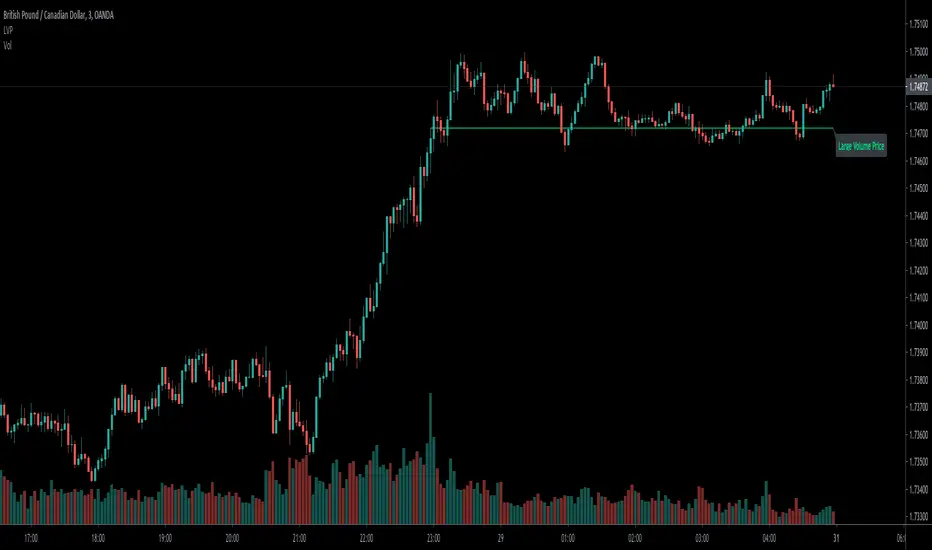
Large volume is meaningful that usually the current price above the highest price of the bars with largest volume usually means uptrend in the short-term.
In the opposite, below it means downtrend.
I coded this indicator to save the efforts to compare it, make it easily to tell the uptrend/downtrend by above/below and color.
Hope you guys enjoy it, and welcome to comment.
The Inputs:
Length:the largest volume of bars of the total bars numbers.
Color:the above/below colors.
Text:Remind this line is large volume R/S.
You can find the video tutorial in my ideas sharing.
Versionshinweise
Hi,Guys,According to feedbacks of invisible,
1.I move the label to the right.
2.The background color of label can be self-defined.
3.Make the line thicker.
Thanks for comment and share how you feel when using it.
Versionshinweise
Hi,guys,According to feedback of indicator, some modified functions as below:
1.Self-defined extend the line to the left largest volume bar or not.(Default is yes)
2.Self-defined the width of line (1-4) to be visible.(Default is 1, thinnest)
Hope you guys enjoy it, and welcome to leave your comments below.
Thanks.
Open-source Skript
Ganz im Sinne von TradingView hat dieser Autor sein/ihr Script als Open-Source veröffentlicht. Auf diese Weise können nun auch andere Trader das Script rezensieren und die Funktionalität überprüfen. Vielen Dank an den Autor! Sie können das Script kostenlos verwenden, aber eine Wiederveröffentlichung des Codes unterliegt unseren Hausregeln.
Haftungsausschluss
Die Informationen und Veröffentlichungen sind nicht als Finanz-, Anlage-, Handels- oder andere Arten von Ratschlägen oder Empfehlungen gedacht, die von TradingView bereitgestellt oder gebilligt werden, und stellen diese nicht dar. Lesen Sie mehr in den Nutzungsbedingungen.