OPEN-SOURCE SCRIPT
VolumeVsVSMAComparison
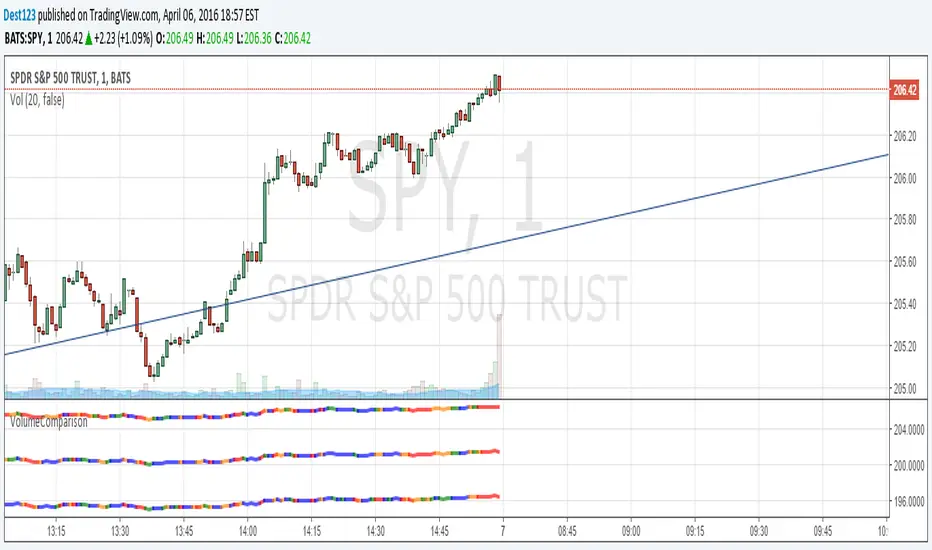
Shows 3 bars. One for the 100sma, one for 25sma, and one for 5sma. The bar color is blue if it's "low volume" compared to the sma, green if it's about average, yellow if it's high, and red if it's very high.
Top bar is 100sma, middle is 25, and bottom is 5
Top bar is 100sma, middle is 25, and bottom is 5
Open-source Skript
Ganz im Sinne von TradingView hat dieser Autor sein/ihr Script als Open-Source veröffentlicht. Auf diese Weise können nun auch andere Trader das Script rezensieren und die Funktionalität überprüfen. Vielen Dank an den Autor! Sie können das Script kostenlos verwenden, aber eine Wiederveröffentlichung des Codes unterliegt unseren Hausregeln.
Haftungsausschluss
Die Informationen und Veröffentlichungen sind nicht als Finanz-, Anlage-, Handels- oder andere Arten von Ratschlägen oder Empfehlungen gedacht, die von TradingView bereitgestellt oder gebilligt werden, und stellen diese nicht dar. Lesen Sie mehr in den Nutzungsbedingungen.