OPEN-SOURCE SCRIPT
Autocorrelation Candles [SS]
Hey everyone, this is the Autocorrelation Candles indicator!
I have formulated it in a way that is similar to the TD 9 candle counting indicators, only instead of TD, its using a lagged autocorrelation of previous candle over a 14 period look back.
It operates similar to trend correlations (for example, my Trend Correlation Oscillator Indicator), however instead of correlating to time, it correlates to itself (autoregression). The theory being, as the autoregression correlation increases and the market becomes too "trendy", we are due for a reversal.
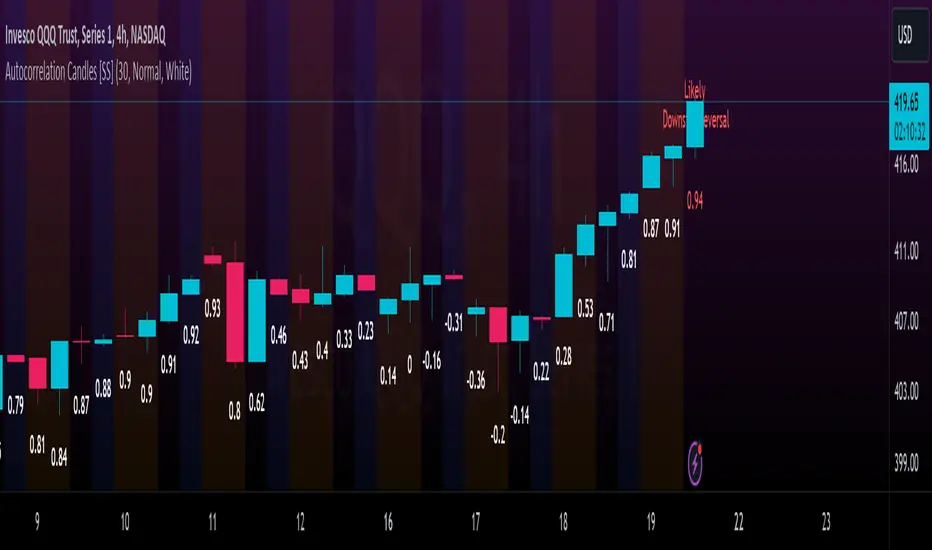
The indicator will display the current lagged correlation of each candle below it. When we approach a period of previous reversal, it will change the colour to orange. When we reach a very high autocorrelation (0.94 or greater), it will turn red and signal a potential reversal to the upside or downside:


Uses:
I will reference this on the larger timeframes (Daily, weekly and 4 hour) about a couple times a week or after a major trend day to see where we are.
You can use this on the smaller timeframes as well, it will work just fine.

Customizations:
I have been listening and learning my lesson, I have made the ability to customize the base text colour to black or white depending on your theme use! SO if you have white theme, you can change to black and vice versa.
As well, if you don't want labels on every candle, in the settings menu there is an option to limit the labels to a desired amount. You select the max amount and it will adjust.
You can also adjust the size of the labels between tiny, medium, and large.
Conclusion
And that's the indicator! Despite being fairly simple in concept, I have been working away on it for a bit with some logistic issues that I finally got sorted.
Hopefully, you enjoy,
Leave your questions below!
Safe trades everyone!
I have formulated it in a way that is similar to the TD 9 candle counting indicators, only instead of TD, its using a lagged autocorrelation of previous candle over a 14 period look back.
It operates similar to trend correlations (for example, my Trend Correlation Oscillator Indicator), however instead of correlating to time, it correlates to itself (autoregression). The theory being, as the autoregression correlation increases and the market becomes too "trendy", we are due for a reversal.
The indicator will display the current lagged correlation of each candle below it. When we approach a period of previous reversal, it will change the colour to orange. When we reach a very high autocorrelation (0.94 or greater), it will turn red and signal a potential reversal to the upside or downside:
Uses:
I will reference this on the larger timeframes (Daily, weekly and 4 hour) about a couple times a week or after a major trend day to see where we are.
You can use this on the smaller timeframes as well, it will work just fine.
Customizations:
I have been listening and learning my lesson, I have made the ability to customize the base text colour to black or white depending on your theme use! SO if you have white theme, you can change to black and vice versa.
As well, if you don't want labels on every candle, in the settings menu there is an option to limit the labels to a desired amount. You select the max amount and it will adjust.
You can also adjust the size of the labels between tiny, medium, and large.
Conclusion
And that's the indicator! Despite being fairly simple in concept, I have been working away on it for a bit with some logistic issues that I finally got sorted.
Hopefully, you enjoy,
Leave your questions below!
Safe trades everyone!
Open-source Skript
Ganz im Sinne von TradingView hat dieser Autor sein/ihr Script als Open-Source veröffentlicht. Auf diese Weise können nun auch andere Trader das Script rezensieren und die Funktionalität überprüfen. Vielen Dank an den Autor! Sie können das Script kostenlos verwenden, aber eine Wiederveröffentlichung des Codes unterliegt unseren Hausregeln.
Get:
- Live Updates,
- Discord access,
- Access to my Proprietary Merlin Software,
- Access to premium indicators,
patreon.com/steversteves
Now on X!
- Live Updates,
- Discord access,
- Access to my Proprietary Merlin Software,
- Access to premium indicators,
patreon.com/steversteves
Now on X!
Haftungsausschluss
Die Informationen und Veröffentlichungen sind nicht als Finanz-, Anlage-, Handels- oder andere Arten von Ratschlägen oder Empfehlungen gedacht, die von TradingView bereitgestellt oder gebilligt werden, und stellen diese nicht dar. Lesen Sie mehr in den Nutzungsbedingungen.