OPEN-SOURCE SCRIPT
Rolling VWAP

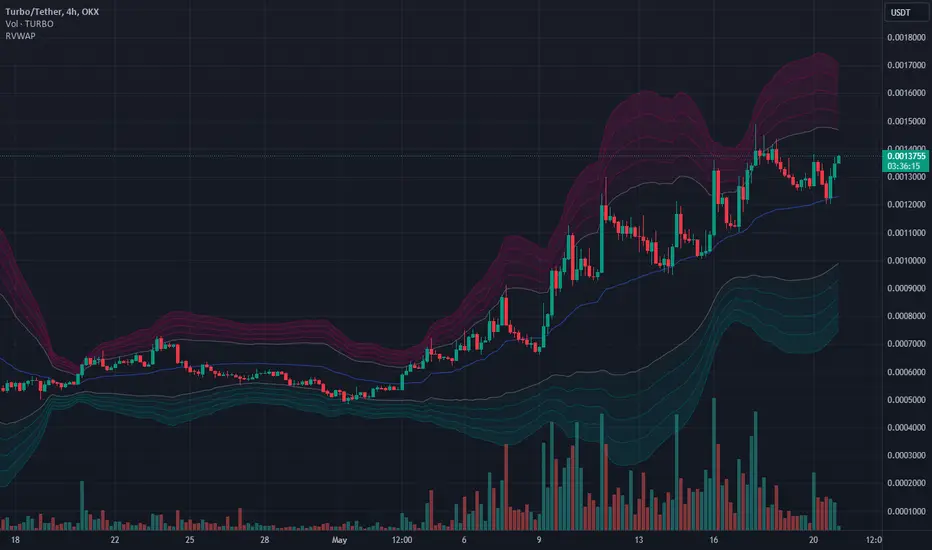
The Rolling VWAP indicator is a powerful technical analysis tool designed to help traders identify significant price levels and potential reversal points. This indicator combines a rolling volume-weighted average price (VWAP) with multiple standard deviation bands to provide a dynamic view of price volatility and market trends.
Key Features:
How to Use:
Best Practices:
By integrating the Rolling VWAP indicator into your trading routine, you can gain a deeper understanding of price dynamics and make more informed trading decisions. Whether you are a day trader, swing trader, or long-term investor, this indicator provides valuable insights to help you navigate the markets with confidence.
Key Features:
- Rolling VWAP Calculation: The indicator calculates the VWAP using the high, low, and close prices (HLC3) over a user-defined rolling period. This VWAP is then plotted on the chart, providing a reliable benchmark for average price levels over a specified timeframe.
- Adjustable Timeframes: Users can select from multiple timeframes (1 hour, 4 hours, 1 day, 3 days, 1 week) to calculate the RVWAP, allowing flexibility to analyze market trends over different periods.
- Multiple Standard Deviation Bands: The indicator includes up to five adjustable standard deviation bands, each with customizable multipliers. These bands are plotted around the RVWAP to indicate potential support and resistance levels, helping traders identify areas of high and low volatility.
- Customizable Display Settings: Users can toggle the visibility of each band and adjust their colors and transparency, making it easy to tailor the indicator to their specific analysis needs.
How to Use:
- Selecting the VWAP Timeframe: Choose the desired timeframe for VWAP calculation from the options provided (1 hour, 4 hours, 1 day, 3 days, 1 week). This allows you to analyze price action over different periods and identify significant trends.
- Adjusting Band Multipliers: Customize the multipliers for each standard deviation band to suit your trading strategy. By default, the indicator includes bands with multipliers of 2.0, 2.5, 3.0, 3.5, and 4.0. Adjust these values based on your preferred levels of price deviation.
- Interpreting the Bands: The standard deviation bands provide key insights into market volatility. Inner Bands (e.g., 2.0 StdDev) indicate areas of normal price fluctuation. Price movement within these bands is generally considered stable. Outer Bands (e.g., 3.5 or 4.0 StdDev) highlight extreme price deviations. Price reaching these bands may signal overbought or oversold conditions, potentially leading to reversals.
- Combining with Other Indicators: Enhance your analysis by using this indicator in conjunction with other technical tools such as moving averages, RSI, or MACD. This helps confirm signals and improve trading decisions.
Best Practices:
- Trend Identification: Use the Rolling VWAP to identify the prevailing market trend. A rising VWAP indicates an uptrend, while a falling VWAP suggests a downtrend.
- Support and Resistance Levels: The standard deviation bands act as dynamic support and resistance levels. Monitor price action around these bands for potential entry and exit points.
- Volatility Analysis: Wider bands indicate higher market volatility, while narrower bands suggest lower volatility. Adjust your trading strategy accordingly based on the observed volatility levels.
- 24/7 Trading Instruments: This indicator is particularly useful for instruments that trade 24/7 and do not have defined sessions, such as cryptocurrencies. Unlike a session-anchored VWAP, the rolling VWAP provides a continuous measure of average price levels, making it ideal for analyzing markets that operate around the clock.
By integrating the Rolling VWAP indicator into your trading routine, you can gain a deeper understanding of price dynamics and make more informed trading decisions. Whether you are a day trader, swing trader, or long-term investor, this indicator provides valuable insights to help you navigate the markets with confidence.
Open-source Skript
Ganz im Sinne von TradingView hat dieser Autor sein/ihr Script als Open-Source veröffentlicht. Auf diese Weise können nun auch andere Trader das Script rezensieren und die Funktionalität überprüfen. Vielen Dank an den Autor! Sie können das Script kostenlos verwenden, aber eine Wiederveröffentlichung des Codes unterliegt unseren Hausregeln.
Haftungsausschluss
Die Informationen und Veröffentlichungen sind nicht als Finanz-, Anlage-, Handels- oder andere Arten von Ratschlägen oder Empfehlungen gedacht, die von TradingView bereitgestellt oder gebilligt werden, und stellen diese nicht dar. Lesen Sie mehr in den Nutzungsbedingungen.