OPEN-SOURCE SCRIPT
Aktualisiert MA cloud + divergence tension
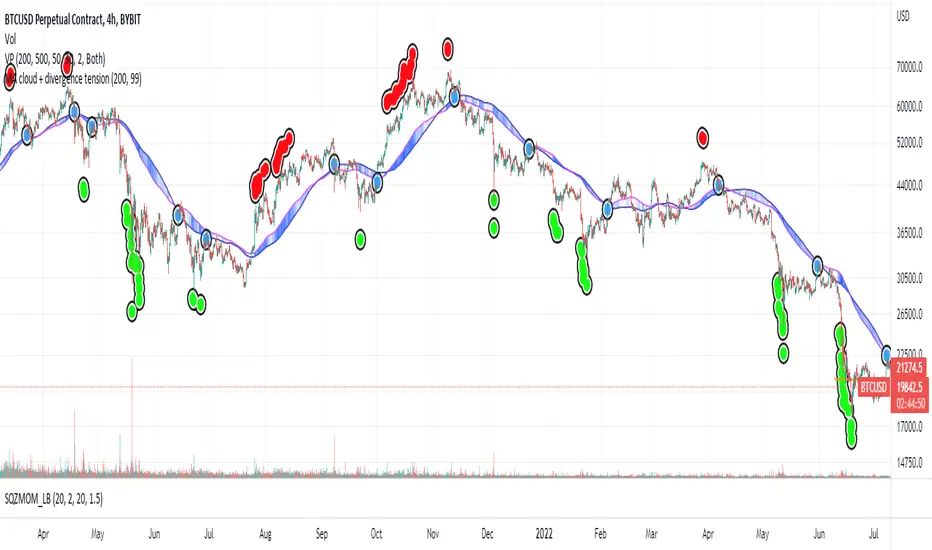
I noticed how well BTC often bounces off the 200 Moving Averages on the 4HR so started investigating ways of visualising the ongoing relationship between price and MAs.
Firstly, this draws a cloud which is made up of the SMA and the EMA, and it colours the cloud based on how far the price is diverging from the middle of the cloud. If the price is the most extreme distance out of the set (by default, the past 200) the cloud will be coloured dark blue. If it's the closest, it will be transparent.
I then looked at plotting these extremes. If the price passes the sensitivity threshold (default 99 - I will look at adding more sensitivity in the future), and by that I mean the price is more divergent than that percentage of other prices inspected in the range, it plots a circle - green if it's oversold, red if it's overbought.
These signal maximum tension between the price and the moving averages. Though when I say maximum, I'm only referring to the historic range! As you can see, often price diverges even further and so more signals are placed. But usually, this tension is resolved, either by the MA cloud moving towards the price or the price moving towards the cloud. With confluence from other indicators, these could be good points to start taking dollar cost averaging, or start taking profits.
Once that tension is released, and the price and cloud converge closely again, we get a blue "relief signal", which could signal that the price action is about to rebound again.
Please be careful with this, it's only for fun. Not investment advice!
If you have any suggestions, comments, criticism, I'd love to hear them,
Thanks
Versionshinweise
simplified the detection of when price moves within the cloud sensitivity area.Open-source Skript
Ganz im Sinne von TradingView hat dieser Autor sein/ihr Script als Open-Source veröffentlicht. Auf diese Weise können nun auch andere Trader das Script rezensieren und die Funktionalität überprüfen. Vielen Dank an den Autor! Sie können das Script kostenlos verwenden, aber eine Wiederveröffentlichung des Codes unterliegt unseren Hausregeln.
Haftungsausschluss
Die Informationen und Veröffentlichungen sind nicht als Finanz-, Anlage-, Handels- oder andere Arten von Ratschlägen oder Empfehlungen gedacht, die von TradingView bereitgestellt oder gebilligt werden, und stellen diese nicht dar. Lesen Sie mehr in den Nutzungsbedingungen.
Open-source Skript
Ganz im Sinne von TradingView hat dieser Autor sein/ihr Script als Open-Source veröffentlicht. Auf diese Weise können nun auch andere Trader das Script rezensieren und die Funktionalität überprüfen. Vielen Dank an den Autor! Sie können das Script kostenlos verwenden, aber eine Wiederveröffentlichung des Codes unterliegt unseren Hausregeln.
Haftungsausschluss
Die Informationen und Veröffentlichungen sind nicht als Finanz-, Anlage-, Handels- oder andere Arten von Ratschlägen oder Empfehlungen gedacht, die von TradingView bereitgestellt oder gebilligt werden, und stellen diese nicht dar. Lesen Sie mehr in den Nutzungsbedingungen.