OPEN-SOURCE SCRIPT
Aktualisiert RSI Trendspotter
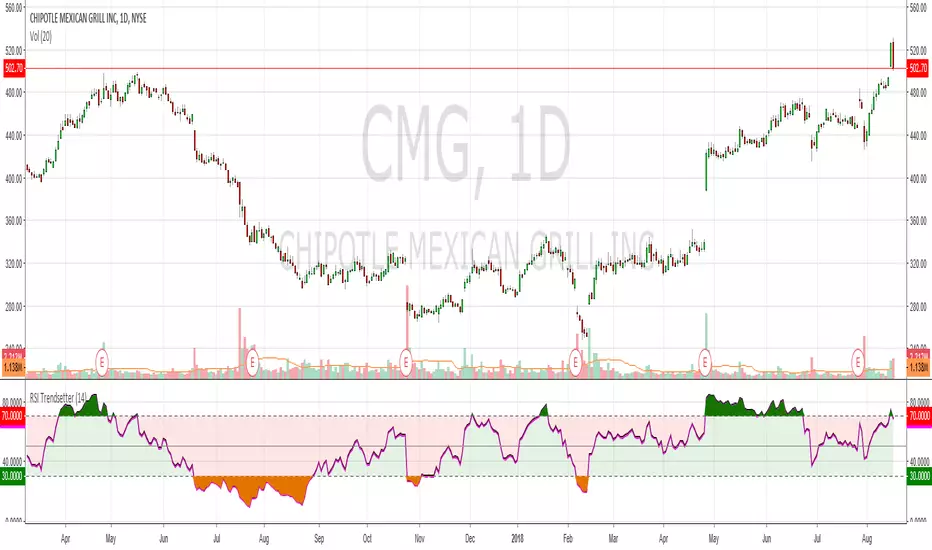
Had a bit of a TA epiphany with RSI so bear with me. The time since RSI was last overbought/sold is a solid trend indicator. This may seem obvious but after x number of years trading it hit me like a smack in the face. I've coded this for easy visualisation. They're fairly simple changes but it's making a big difference in my trendspotting already.
In the example CMG hasn't been overbought for 183 days, so the RSI is mostly green:
Before that it hadn't been oversold for 199 days, so RSI is mostly red:
And before that it was ranging like a maf*ckin' sine wave, so the RSI shows green, red, green, red, etc.:
Finally, normal RSI for comparison. Same data, but now with pretty colours:
I've also added overbought/oversold highlights cause that just makes the whole charting thing a lot easier. Enjoy!
Versionshinweise
Bugger, I said overbought when I mean oversold and vice-versaVersionshinweise
Added plot descriptions so peeps and change colours easily. Thanks to FLOW for the feedbackVersionshinweise
Fixed an issue with colour and the source. Due to Pine Script limitations it's not possible to make this look the same on a black chart, so you will need to manually adjust the colours when you add it to your chartOpen-source Skript
Ganz im Sinne von TradingView hat dieser Autor sein/ihr Script als Open-Source veröffentlicht. Auf diese Weise können nun auch andere Trader das Script rezensieren und die Funktionalität überprüfen. Vielen Dank an den Autor! Sie können das Script kostenlos verwenden, aber eine Wiederveröffentlichung des Codes unterliegt unseren Hausregeln.
Haftungsausschluss
Die Informationen und Veröffentlichungen sind nicht als Finanz-, Anlage-, Handels- oder andere Arten von Ratschlägen oder Empfehlungen gedacht, die von TradingView bereitgestellt oder gebilligt werden, und stellen diese nicht dar. Lesen Sie mehr in den Nutzungsbedingungen.
Open-source Skript
Ganz im Sinne von TradingView hat dieser Autor sein/ihr Script als Open-Source veröffentlicht. Auf diese Weise können nun auch andere Trader das Script rezensieren und die Funktionalität überprüfen. Vielen Dank an den Autor! Sie können das Script kostenlos verwenden, aber eine Wiederveröffentlichung des Codes unterliegt unseren Hausregeln.
Haftungsausschluss
Die Informationen und Veröffentlichungen sind nicht als Finanz-, Anlage-, Handels- oder andere Arten von Ratschlägen oder Empfehlungen gedacht, die von TradingView bereitgestellt oder gebilligt werden, und stellen diese nicht dar. Lesen Sie mehr in den Nutzungsbedingungen.