Gold Spotter
Two “Baskets” of Data
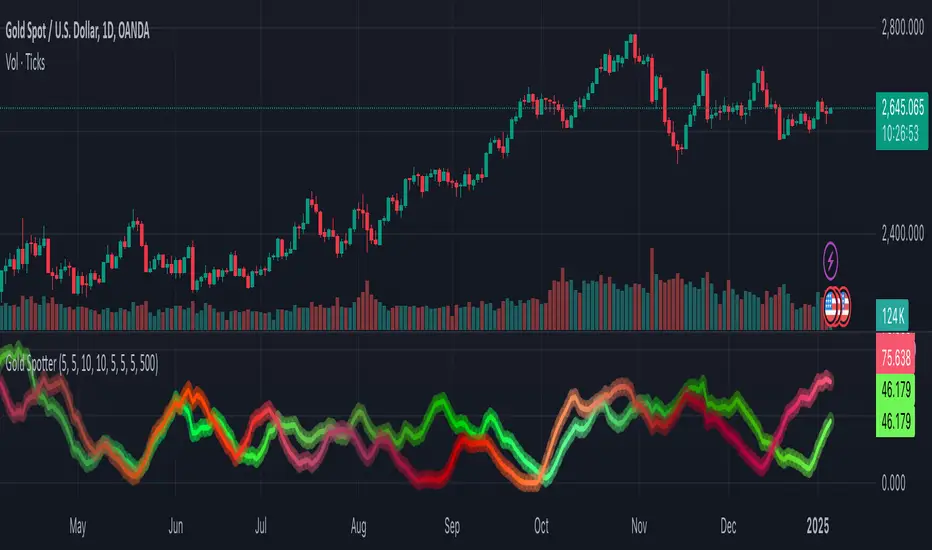
The script constructs two composite values (one green, one red) by fetching certain currency-related data in the background. Each composite is normalized over a lookback period so both lines map into a 0–100 range.
Weighting by Another Security’s Trend
A ratio is calculated from the chart’s own price vs. its moving average. That ratio is raised to a specified “power” (configured by the user), then used to scale each composite. This means if the price is above its average, both lines can be inflated; if below, both lines can be suppressed.
What the Lines Represent
Green Line: Represents a “pegged basket” index. (A small group of instruments that historically move in a certain way relative to Gold.)
Red Line: Represents an “exotics basket” index. (A different group of instruments that also has a meaningful relationship to Gold.)
What Is It Predicting
By measuring hidden relationships between these two baskets and weighting them by the chart’s trend, the green/red lines often provide an early read on which direction Gold might take next usually leading by 3-7 days.
Skript nur auf Einladung
Ausschließlich Nutzer mit einer Erlaubnis des Autors können Zugriff auf dieses Script erhalten. Sie müssen diese Genehmigung bei dem Autor beantragen. Dies umfasst üblicherweise auch eine Zahlung. Wenn Sie mehr erfahren möchten, dann sehen Sie sich unten die Anweisungen des Autors an oder kontaktieren Sie JoeTheGoldTrader direkt.
Es handelt sich hierbei um ein privates "Invite-Only" Script, welches nicht von unseren Script-Moderatoren geprüft wurde. Demzufolge wurde auch nicht ermittelt, ob es unseren Hausregeln entspricht. TradingView empfiehlt NICHT, für die Nutzung eines Scripts zu bezahlen, wenn Sie den Autor nicht als vertrauenswürdig halten und verstehen, wie das Script funktioniert. Sie können außerdem auch kostenlose Open-Source-Alternativen in unseren Community-Scripts finden.
Hinweise des Autors
Haftungsausschluss
Skript nur auf Einladung
Ausschließlich Nutzer mit einer Erlaubnis des Autors können Zugriff auf dieses Script erhalten. Sie müssen diese Genehmigung bei dem Autor beantragen. Dies umfasst üblicherweise auch eine Zahlung. Wenn Sie mehr erfahren möchten, dann sehen Sie sich unten die Anweisungen des Autors an oder kontaktieren Sie JoeTheGoldTrader direkt.
Es handelt sich hierbei um ein privates "Invite-Only" Script, welches nicht von unseren Script-Moderatoren geprüft wurde. Demzufolge wurde auch nicht ermittelt, ob es unseren Hausregeln entspricht. TradingView empfiehlt NICHT, für die Nutzung eines Scripts zu bezahlen, wenn Sie den Autor nicht als vertrauenswürdig halten und verstehen, wie das Script funktioniert. Sie können außerdem auch kostenlose Open-Source-Alternativen in unseren Community-Scripts finden.