OPEN-SOURCE SCRIPT
Top/Bottom Detector

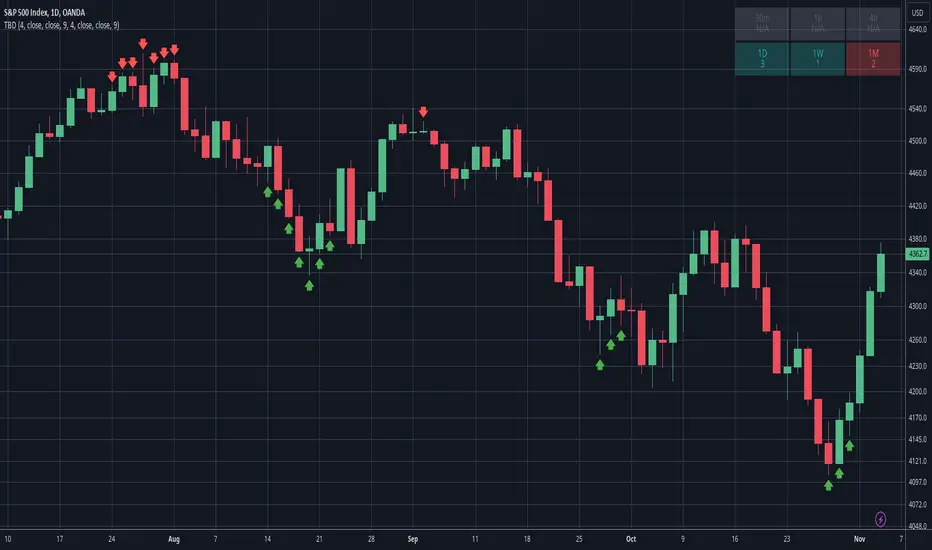
This indicator tries to detect tops and bottoms based on time and price. It counts candles using a simple criteria in both bullish and bearish directions. The count is added by 1 for each consecutive candle that matches this criteria. When a candle doesn't match the criteria the count is broken and will start over. A top or bottom is detected when the count reaches its maximum and is plotted on the chart as a red arrow (top) or a green arrow (bottom). Be aware that a top or bottom can be extended for several time periods and is broken only when the criteria no longer matches. Depending on your trading strategy, it can be advised to wait for the top/bottom to be broken before entering the trade.
How it works
The bullish count compares current candle with a candle X periods in the past. If the current candle price is higher than the past candle it matches and the count is added by 1. The bearish count works in the same way as the bullish count except that it matches if the current candle price is lower than the past candle instead of higher. The default parameters is to compare current candle close with the candle close 4 periods in the past, using a count of 9 as the maximum that detects a top or bottom. These values can all be adjusted in the settings.
Multi Timeframe Table
The multi timeframe table is visible by default in the top right corner. It gives some insight in what the count is for the current ticker in different timeframes. A bullish count will color the cell green and a bearish count red. Note that only timeframes higher or equal to what is used on the chart can be displayed. Any lower timeframes in the table will be grayed out and show the text N/A.
Alerts
Alerts can be setup when a bottom or top is detected. Using the "Any alert() function call" condition will alert both bottoms and tops.
Open-source Skript
Ganz im Sinne von TradingView hat dieser Autor sein/ihr Script als Open-Source veröffentlicht. Auf diese Weise können nun auch andere Trader das Script rezensieren und die Funktionalität überprüfen. Vielen Dank an den Autor! Sie können das Script kostenlos verwenden, aber eine Wiederveröffentlichung des Codes unterliegt unseren Hausregeln.
Haftungsausschluss
Die Informationen und Veröffentlichungen sind nicht als Finanz-, Anlage-, Handels- oder andere Arten von Ratschlägen oder Empfehlungen gedacht, die von TradingView bereitgestellt oder gebilligt werden, und stellen diese nicht dar. Lesen Sie mehr in den Nutzungsbedingungen.