OPEN-SOURCE SCRIPT
Aktualisiert RK's 15 ∴ Timeframed Multiple MA Types Ribbon

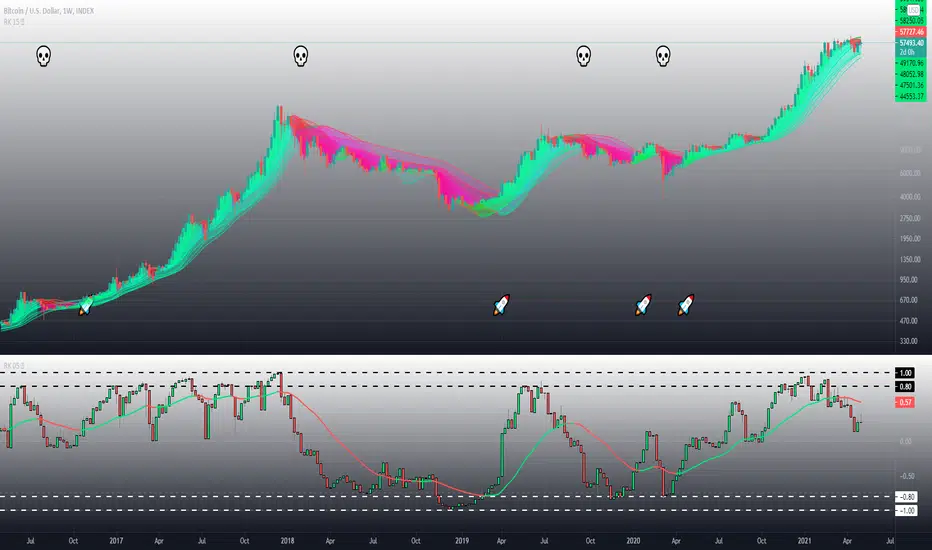
I developed this indicator focusing on the KISS (Keep It Simple, Stupid) to help me in a more direct and visual way when enteringand exiting my market position.
The idea is to configure the indicator with your favorite Moving Averages and Lengths and Enter Long when the price is above and Short when the price is below.
I put the setup that I am testing now in the tooltips to give an example.
The idea is to configure the indicator with your favorite Moving Averages and Lengths and Enter Long when the price is above and Short when the price is below.
I put the setup that I am testing now in the tooltips to give an example.
Versionshinweise
I put an alert() function with a plottable char when the pre-selected source crossover or crossunder all Moving Average Lines, and some small updates.Versionshinweise
█ UpdateI put 6 more lines, and then I remade part of the code to get better performance.
█ Inputs Explanation:
• Source → Is the source of all moving averages lines;
• Timeframe → Is the time resolution of the moving average that will be drawn in the chart;
• "Length Numbers as Fibonacci nth Term." →
Check (✅) if you are like me and always use the Fibonacci sequence numbers in length to only put the nth term like 8 as 21, 10 as 55, 12 as 144. Put the mouse on the tooltip icon (ⓘ) to see the list of usable inputs. This is very good to fast different lengths.
• Moving Average Lines → For each line, select the moving average type, the length, and the uptrend and downtrend colors. To help the study, you can choose "Equal to the Line Above" to use the same type of last moving average or "Turn off this MA line" to skip this line.
• Base Line To Change Ribbon Colors → This is the condition of when the Ribbons change colors. Each moving average ribbon will change the color every time this source (in the same timeframe of the chart) cross the respective line.
• "Draw Symmetrically Weighted Moving Average (SWMA) of the Lines?" → This is a pure aesthetics option to see smoothed lines.
I think the other inputs are straightforward to understand.
█ Tips:
• Start with only 1 or 2 lines and test your favorites moving average types with short lengths.
• Try to sync the alerts pictures with the best time to enter and exit a position without care to traps or fake movements.
• Keep this idea to the following 5 to 9 lines, test another moving average or length, pic the same colors to all these first lines, and get many excellent opportunities alerts.
• To the last Lines, search for slowest Moving Averages and Lengths that will prevent you from falling into a fake trend or a trap. This should reduce a lot of your alerts but, the idea is to avoid too risks ordres.
• With all configurated, select a different Timeframe in this indicator input to see if you could get faster or safer alerts.
In any case, I wish you all good and profitable operations.
Open-source Skript
Ganz im Sinne von TradingView hat dieser Autor sein/ihr Script als Open-Source veröffentlicht. Auf diese Weise können nun auch andere Trader das Script rezensieren und die Funktionalität überprüfen. Vielen Dank an den Autor! Sie können das Script kostenlos verwenden, aber eine Wiederveröffentlichung des Codes unterliegt unseren Hausregeln.
Feel free to share your success with me: 🤑👍
BTC - bc1qq23w655arvclce7u8zkt4lag08fnctgccs9s9s
ETH - 0xf6cf166Ea5EC550372e179dB1AF579a29Cb91dDf
USDT - 0x8DbC0E889Afb3bec7241eD0E42429A612aa30015 - (ERC20)
BTC - bc1qq23w655arvclce7u8zkt4lag08fnctgccs9s9s
ETH - 0xf6cf166Ea5EC550372e179dB1AF579a29Cb91dDf
USDT - 0x8DbC0E889Afb3bec7241eD0E42429A612aa30015 - (ERC20)
Haftungsausschluss
Die Informationen und Veröffentlichungen sind nicht als Finanz-, Anlage-, Handels- oder andere Arten von Ratschlägen oder Empfehlungen gedacht, die von TradingView bereitgestellt oder gebilligt werden, und stellen diese nicht dar. Lesen Sie mehr in den Nutzungsbedingungen.