OPEN-SOURCE SCRIPT
Abacus Community Williams %R + Bollinger %B

📌 Indicator Description (Professional & Clear)
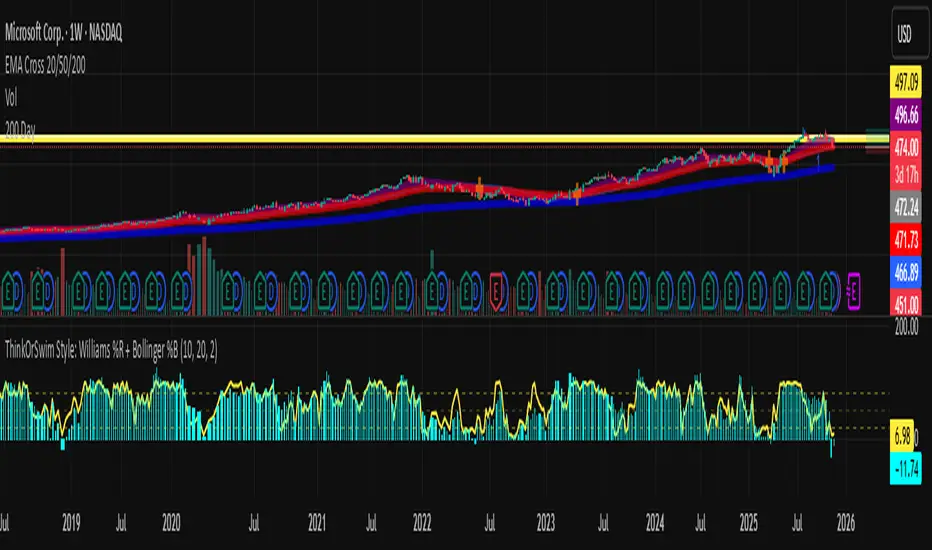
Williams %R + Bollinger %B Momentum Indicator (ThinkOrSwim Style)
This custom indicator combines Williams %R and Bollinger %B into a single, unified panel to provide a powerful momentum-and-positioning view of price action. Modeled after the ThinkOrSwim version used by professional traders, it displays:
✅ Williams %R (10-period) – Yellow Line
This oscillator measures the market's position relative to recent highs and lows.
It plots on a 0% to 100% scale, where:
80–100% → Overbought region
20–0% → Oversold region
50% → Momentum equilibrium
Williams %R helps identify exhaustion, trend strength, and potential reversal zones.
✅ Bollinger %B (20, 2.0) – Turquoise Histogram Bars
%B shows where price is trading relative to the Bollinger Bands:
Above 50% → Price is in the upper half of the band (bullish pressure)
Below 50% → Price is in the lower half (bearish pressure)
Near 100% → Price pushing upper band (possible breakout)
Near 0% → Price testing lower band (possible breakdown)
The histogram visually represents momentum shifts in real time, creating a clean profile of volatility and strength.
🎯 Why This Combination Works
Together, Williams %R and Bollinger %B reveal:
Momentum direction
Overbought/oversold conditions
Volatility compression & expansion
Trend continuation vs reversal zones
High-probability inflection points
Williams %R shows oscillation and exhaustion, while %B shows pressure inside volatility bands.
The combination helps identify whether momentum supports the current trend or is weakening.
🔍 Use Cases
Detect early trend reversals
Validate breakouts and breakdowns
Spot momentum failure in price extremes
Confirm pullbacks and continuation setups
Time entries and exits with higher precision
💡 Best For
Swing traders
Momentum traders
Trend-followers
Options traders (for timing premium decay or volatility expansion)
Open-source Skript
Ganz im Sinne von TradingView hat dieser Autor sein/ihr Script als Open-Source veröffentlicht. Auf diese Weise können nun auch andere Trader das Script rezensieren und die Funktionalität überprüfen. Vielen Dank an den Autor! Sie können das Script kostenlos verwenden, aber eine Wiederveröffentlichung des Codes unterliegt unseren Hausregeln.
Haftungsausschluss
Die Informationen und Veröffentlichungen sind nicht als Finanz-, Anlage-, Handels- oder andere Arten von Ratschlägen oder Empfehlungen gedacht, die von TradingView bereitgestellt oder gebilligt werden, und stellen diese nicht dar. Lesen Sie mehr in den Nutzungsbedingungen.