OPEN-SOURCE SCRIPT
Fisher Transform on RSI

Overview
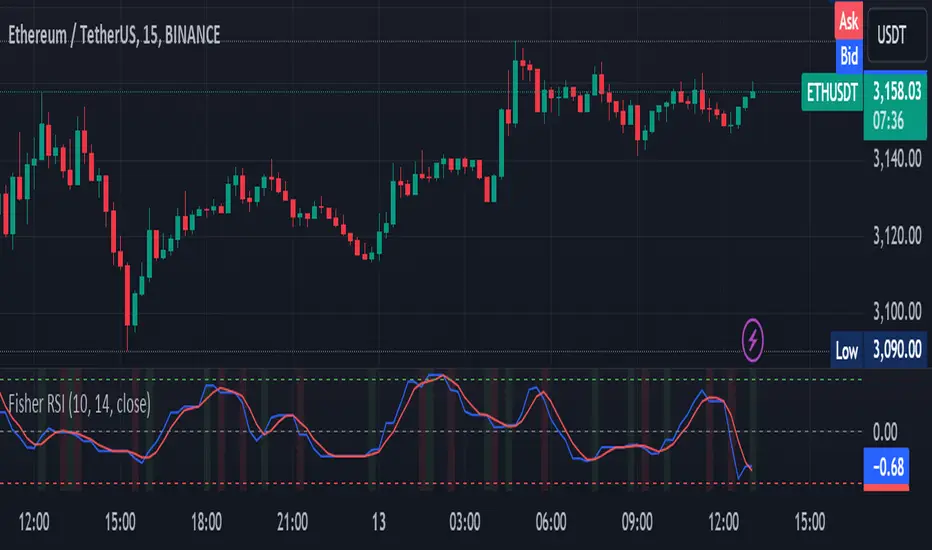
The Fisher Transform on RSI indicator combines the Relative Strength Index (RSI) with the Fisher Transform to offer a refined tool for identifying market turning points and trends. By applying the Fisher Transform to the RSI, this indicator converts RSI values into a Gaussian normal distribution, enhancing the precision of detecting overbought and oversold conditions. This method provides a clearer and more accurate identification of potential market reversals than the standard RSI.
Key/Unique Features
How It Works
Usage Instructions
The Fisher Transform on RSI indicator combines the Relative Strength Index (RSI) with the Fisher Transform to offer a refined tool for identifying market turning points and trends. By applying the Fisher Transform to the RSI, this indicator converts RSI values into a Gaussian normal distribution, enhancing the precision of detecting overbought and oversold conditions. This method provides a clearer and more accurate identification of potential market reversals than the standard RSI.
Key/Unique Features
- Fisher Transform Applied to RSI: Transforms RSI values into a Gaussian normal distribution, improving the detection of overbought and oversold conditions.
- Smoothing: Applies additional smoothing to the Fisher Transform, reducing noise and providing clearer signals.
- Signal Line: Includes a signal line to identify crossover points, indicating potential buy or sell signals.
- Custom Alerts: Built-in alert conditions for bullish and bearish crossovers, keeping traders informed of significant market movements.
- Visual Enhancements: Background color changes based on crossover conditions, offering immediate visual cues for potential trading opportunities.
How It Works
- RSI Calculation: The indicator calculates the Relative Strength Index (RSI) based on the selected source and period length.
- Normalization: The RSI values are normalized to fit within a range of -1 to 1, which is essential for the Fisher Transform.
- Fisher Transform: The normalized RSI values undergo the Fisher Transform, converting them into a Gaussian normal distribution.
- Smoothing: The transformed values are smoothed using a simple moving average to reduce noise and provide more reliable signals.
- Signal Line: A signal line, which is a simple moving average of the smoothed Fisher Transform, is plotted to identify crossover points.
- Alerts and Visuals: Custom alert conditions are set for bullish and bearish crossovers, and the background color changes to indicate these conditions.
Usage Instructions
- Trend Identification: Use the Fisher Transform on RSI to identify overbought and oversold conditions with enhanced precision, aiding in spotting potential trend reversals.
- Trade Signals: Monitor the crossovers between the smoothed Fisher Transform and the signal line. A bullish crossover suggests a potential buying opportunity, while a bearish crossover indicates a potential selling opportunity.
- Alerts: Set custom alerts based on the built-in conditions to receive notifications when important crossover events occur, ensuring you never miss a trading opportunity.
- Visual Cues: Utilize the background color changes to quickly identify bullish (green) and bearish (red) conditions, providing immediate visual feedback on market sentiment.
- Complementary Analysis: Combine this indicator with other technical analysis tools and indicators to enhance your overall trading strategy and make more informed decisions.
Open-source Skript
Ganz im Sinne von TradingView hat dieser Autor sein/ihr Script als Open-Source veröffentlicht. Auf diese Weise können nun auch andere Trader das Script rezensieren und die Funktionalität überprüfen. Vielen Dank an den Autor! Sie können das Script kostenlos verwenden, aber eine Wiederveröffentlichung des Codes unterliegt unseren Hausregeln.
Haftungsausschluss
Die Informationen und Veröffentlichungen sind nicht als Finanz-, Anlage-, Handels- oder andere Arten von Ratschlägen oder Empfehlungen gedacht, die von TradingView bereitgestellt oder gebilligt werden, und stellen diese nicht dar. Lesen Sie mehr in den Nutzungsbedingungen.