OPEN-SOURCE SCRIPT
Aktualisiert Volume Pivot
OVERVIEW
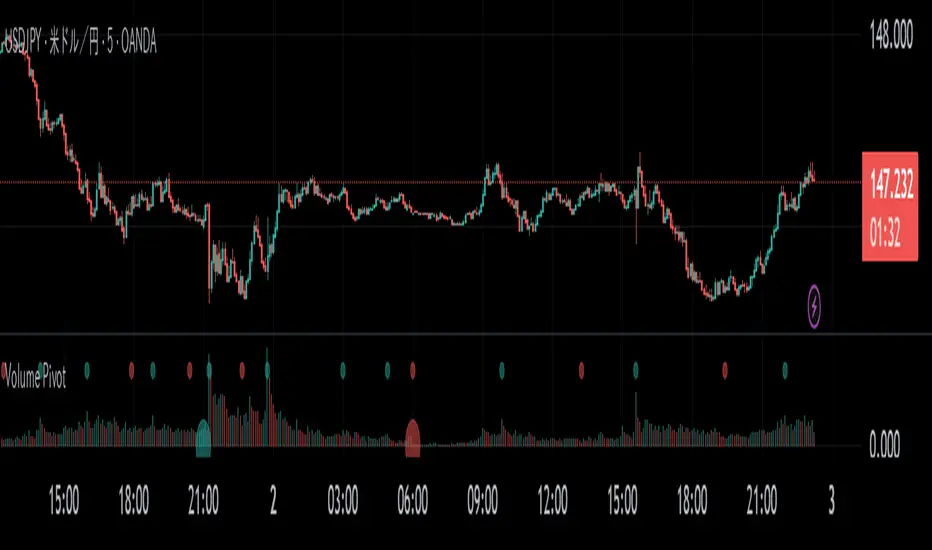
Volume Pivot is a technical analysis tool for TradingView designed to identify key turning points in the market by focusing on volume rather than price. It detects peaks and troughs (pivots) in trading volume to pinpoint moments of maximum market interest or exhaustion.
This indicator performs its analysis on both the Current Timeframe (CTF) and a user-defined Higher Timeframe (HTF). This dual-perspective approach allows traders to simultaneously grasp short-term market reactions and long-term structural shifts, leading to more informed and high-conviction trading decisions.
FEATURES
- Automatic Pivot Detection
Automatically identifies and plots Volume Pivot Highs (peaks) and Pivot Lows (troughs) based on a user-defined Lookback Length. - Dual Timeframe Display
- CTF Signals: Plotted as tiny circles directly above the corresponding volume bars for immediate, short-term context.
- HTF Signals: Plotted as slightly larger circles at the bottom of the indicator pane, making them easy to distinguish as signals of higher significance. - Flexible HTF Configuration
Customize which higher timeframe to use for analysis based on your current chart timeframe. For example, you can set the indicator to reference the 1-hour chart as the HTF when you are on the 5-minute chart, and the Daily chart as the HTF when you are on the 1-hour chart. - Intuitive Volume Bars
The volume bars are color-coded to show whether volume is increasing (bullish color) or decreasing (bearish color) compared to the previous bar, offering a quick visual gauge of market momentum. - Full Customization
Easily toggle the visibility of CTF and HTF signals and customize the colors for bullish and bearish pivots to match your charting preferences.
Versionshinweise
- a little fix(remove htf_get_barindex function)Open-source Skript
Ganz im Sinne von TradingView hat dieser Autor sein/ihr Script als Open-Source veröffentlicht. Auf diese Weise können nun auch andere Trader das Script rezensieren und die Funktionalität überprüfen. Vielen Dank an den Autor! Sie können das Script kostenlos verwenden, aber eine Wiederveröffentlichung des Codes unterliegt unseren Hausregeln.
Haftungsausschluss
Die Informationen und Veröffentlichungen sind nicht als Finanz-, Anlage-, Handels- oder andere Arten von Ratschlägen oder Empfehlungen gedacht, die von TradingView bereitgestellt oder gebilligt werden, und stellen diese nicht dar. Lesen Sie mehr in den Nutzungsbedingungen.
Open-source Skript
Ganz im Sinne von TradingView hat dieser Autor sein/ihr Script als Open-Source veröffentlicht. Auf diese Weise können nun auch andere Trader das Script rezensieren und die Funktionalität überprüfen. Vielen Dank an den Autor! Sie können das Script kostenlos verwenden, aber eine Wiederveröffentlichung des Codes unterliegt unseren Hausregeln.
Haftungsausschluss
Die Informationen und Veröffentlichungen sind nicht als Finanz-, Anlage-, Handels- oder andere Arten von Ratschlägen oder Empfehlungen gedacht, die von TradingView bereitgestellt oder gebilligt werden, und stellen diese nicht dar. Lesen Sie mehr in den Nutzungsbedingungen.