OPEN-SOURCE SCRIPT
Volume accumulation on past range [TCS] | VTA
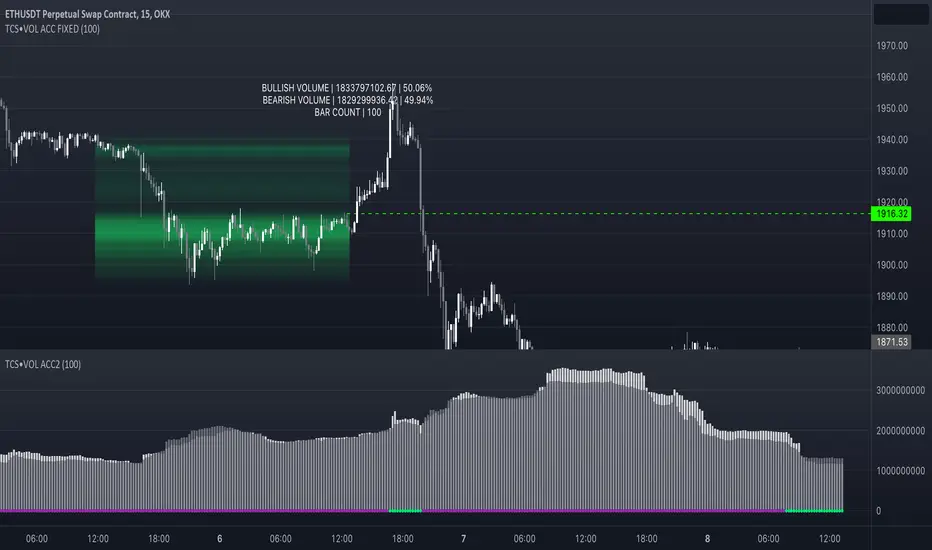
The indicator calculates buy and sell volume values for different look-back periods based on the high, low, close, and tick volume data of the chart.
The range can be selected by adding the end date and the look-back period, which starts from the end date. It can calculate a maximum of 100 candlesticks.
The calculated buy and sell volume values are stored in separate variables, representing cumulative volume values over their respective look-back periods. It's important to note that the provided code calculates the buy and sell volume values individually for each look-back period and then sums them.
This information can be useful in understanding who is in control of the market during the selected range. The 'heatmap' is particularly helpful in identifying areas of high or low trading activity, which can help define support and resistance levels.
For example, if there is a greater accumulation of bullish volume than bearish volume and a break occurs in a resistance area, it may present a good entry opportunity.

Please note that this indicator is for educational purposes only and should not be used for trading without further testing and analysis.
The range can be selected by adding the end date and the look-back period, which starts from the end date. It can calculate a maximum of 100 candlesticks.
The calculated buy and sell volume values are stored in separate variables, representing cumulative volume values over their respective look-back periods. It's important to note that the provided code calculates the buy and sell volume values individually for each look-back period and then sums them.
This information can be useful in understanding who is in control of the market during the selected range. The 'heatmap' is particularly helpful in identifying areas of high or low trading activity, which can help define support and resistance levels.
For example, if there is a greater accumulation of bullish volume than bearish volume and a break occurs in a resistance area, it may present a good entry opportunity.
Please note that this indicator is for educational purposes only and should not be used for trading without further testing and analysis.
Open-source Skript
Ganz im Sinne von TradingView hat dieser Autor sein/ihr Script als Open-Source veröffentlicht. Auf diese Weise können nun auch andere Trader das Script rezensieren und die Funktionalität überprüfen. Vielen Dank an den Autor! Sie können das Script kostenlos verwenden, aber eine Wiederveröffentlichung des Codes unterliegt unseren Hausregeln.
For the access to premium indicators please contact me on tradingview
Haftungsausschluss
Die Informationen und Veröffentlichungen sind nicht als Finanz-, Anlage-, Handels- oder andere Arten von Ratschlägen oder Empfehlungen gedacht, die von TradingView bereitgestellt oder gebilligt werden, und stellen diese nicht dar. Lesen Sie mehr in den Nutzungsbedingungen.