OPEN-SOURCE SCRIPT
Aktualisiert Future SD Projection
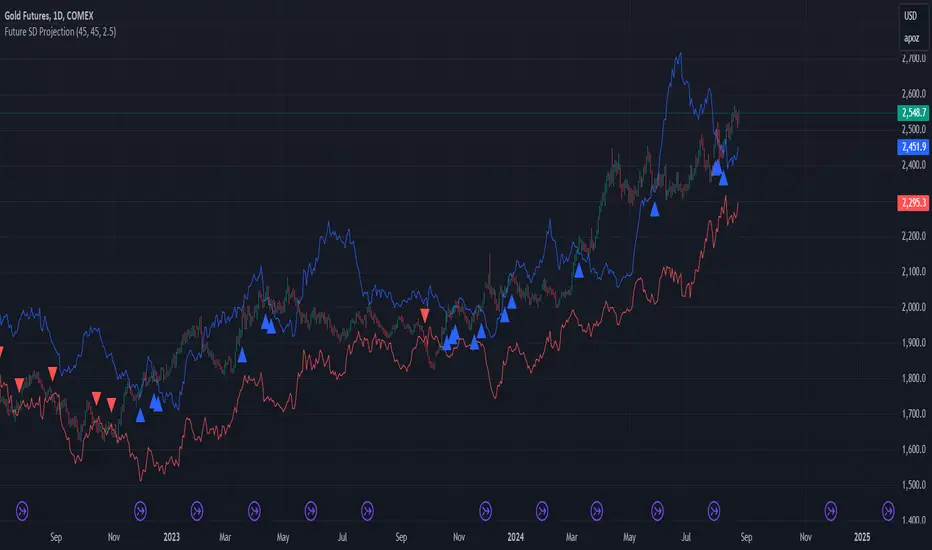
Future Standard Deviation Projector
This innovative indicator projects price volatility into the future, helping traders anticipate potential price ranges and breakouts. It calculates standard deviation bands based on recent price action and extends them forward, providing a unique perspective on future price movement possibilities.
Key Features:
- Projects standard deviation bands into the future
- Customizable lookback period for volatility calculation
- Adjustable future projection timeframe
- Flexible standard deviation multiplier
- Clear visual signals for band breaches
How it works:
1. Calculates standard deviation from recent closing prices
2. Projects upper and lower bands into the future
3. Plots these bands on the chart
4. Signals with arrows when closing price crosses projected bands
Use this indicator to:
- Gauge potential future price ranges
- Identify possible breakout levels
- Assess market volatility expectations
- Enhance your trading strategy with forward-looking volatility projections
Customize the settings to align with your trading timeframe and risk tolerance. Remember, while this tool offers valuable insights, it should be used in conjunction with other analysis methods for comprehensive trading decisions.
Note: Past performance and projections do not guarantee future results. Always manage your risk appropriately.
Versionshinweise
Future Standard Deviation ProjectorThis innovative indicator projects price volatility into the future, helping traders anticipate potential price ranges and breakouts. It calculates standard deviation bands based on recent price action and extends them forward, providing a unique perspective on future price movement possibilities.
Key Features:
- Projects standard deviation bands into the future
- Customizable lookback period for volatility calculation
- Adjustable future projection timeframe
- Flexible standard deviation multiplier
- Clear visual signals for band breaches
How it works:
1. Calculates standard deviation from recent closing prices
2. Projects upper and lower bands into the future
3. Plots these bands on the chart
4. Signals with arrows when closing price crosses projected bands
Use this indicator to:
- Gauge potential future price ranges
- Identify possible breakout levels
- Assess market volatility expectations
- Enhance your trading strategy with forward-looking volatility projections
Customize the settings to align with your trading timeframe and risk tolerance. Remember, while this tool offers valuable insights, it should be used in conjunction with other analysis methods for comprehensive trading decisions.
Note: Past performance and projections do not guarantee future results. Always manage your risk appropriately.
Open-source Skript
Ganz im Sinne von TradingView hat dieser Autor sein/ihr Script als Open-Source veröffentlicht. Auf diese Weise können nun auch andere Trader das Script rezensieren und die Funktionalität überprüfen. Vielen Dank an den Autor! Sie können das Script kostenlos verwenden, aber eine Wiederveröffentlichung des Codes unterliegt unseren Hausregeln.
Haftungsausschluss
Die Informationen und Veröffentlichungen sind nicht als Finanz-, Anlage-, Handels- oder andere Arten von Ratschlägen oder Empfehlungen gedacht, die von TradingView bereitgestellt oder gebilligt werden, und stellen diese nicht dar. Lesen Sie mehr in den Nutzungsbedingungen.