OPEN-SOURCE SCRIPT
Aktualisiert TICK Grid (TheMas7er)
█ OVERVIEW
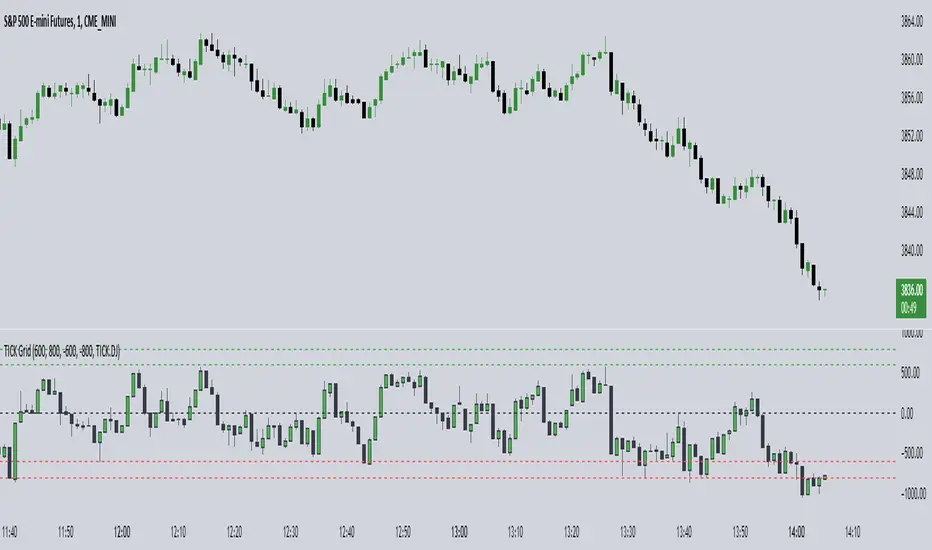
Shows the NYSE Tick Index, as it is used by TheMas7er.
This indicator has several customization options built-in that can be configured:
• Positive and negative threshold levels with show/hide option and color selection.
• Zero line with show/hide option and color selection.
• Bar colors are fully customizable.
• Symbol can be changed. Default is USI:TICK for the New York Stock Exchange.
Tick Indices are available in TradingView as a symbol - just like any other stock - which you can show on a chart.
This script adds a pane with your selected Tick Index, which can then be used as an indicator to make short-term trading decisions.
█ CONCEPTS
The Tick Index is a short-term barometer of internal market strength.
It shows the number of stocks trading on an uptick minus the number of stocks trading on a downtick, and is used by day traders to view the overall market sentiment at a given point in time.
It's categorized as a Breadth Indicator because it analyzes the "Breadth and Scope" of an entire Index.
Since the Tick Index measures the up/down ticks of a universe of stocks, any collection of stocks (market,index,...) could theoretically have it's own Tick Index.
Some of the major Tick Indices are:
• USI:TICK for the New York Stock Exchange
• USI:TICKQ for Nasdaq
• USI:TICKI for the Down Jones
Versionshinweise
Bugfix: up/down candle colors were inverted.Versionshinweise
Updated chart to reflect correction of up/down candle colors that were inverted.Versionshinweise
Updated chart to show the 1 minute timeframe.Versionshinweise
Bugfix: Ticker was hard-coded, and didn't change with the input selection.h/t to mojotv1 who was the first to notice and report this obvious mistake.
Open-source Skript
Ganz im Sinne von TradingView hat dieser Autor sein/ihr Script als Open-Source veröffentlicht. Auf diese Weise können nun auch andere Trader das Script rezensieren und die Funktionalität überprüfen. Vielen Dank an den Autor! Sie können das Script kostenlos verwenden, aber eine Wiederveröffentlichung des Codes unterliegt unseren Hausregeln.
Haftungsausschluss
Die Informationen und Veröffentlichungen sind nicht als Finanz-, Anlage-, Handels- oder andere Arten von Ratschlägen oder Empfehlungen gedacht, die von TradingView bereitgestellt oder gebilligt werden, und stellen diese nicht dar. Lesen Sie mehr in den Nutzungsbedingungen.