OPEN-SOURCE SCRIPT
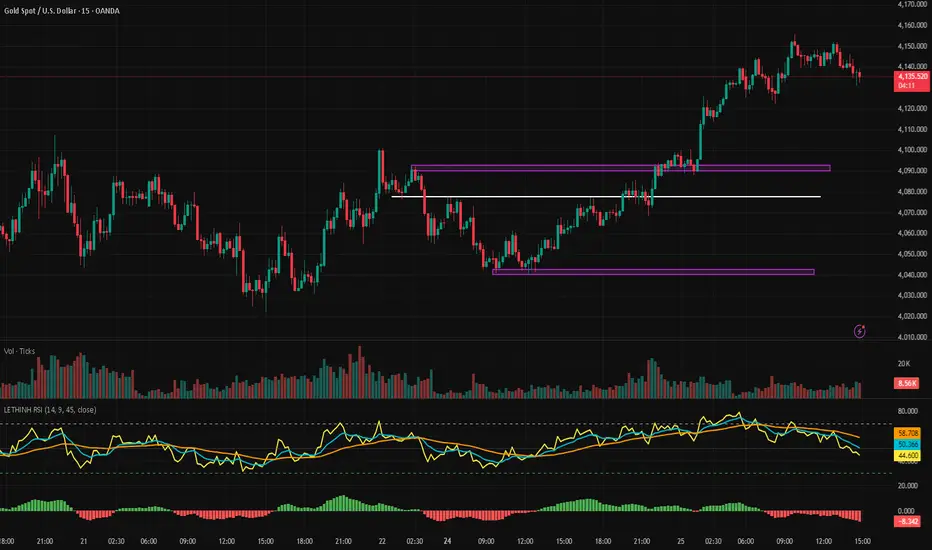
LETHINH RSI

Title:
RSI + EMA9 + WMA45 Strength Flow Indicator
Description:
This indicator enhances the traditional RSI by combining it with two dynamic moving averages (EMA9 and WMA45) applied directly to the RSI line. The goal is to help traders visually identify momentum strength, trend confirmation, and potential reversal points with greater accuracy.
How It Works:
• RSI (14): Measures market momentum and identifies overbought/oversold conditions.
• EMA9 on RSI: A fast-response signal line that tracks short-term shifts in buyer/seller strength.
• WMA45 on RSI: A slower, smoother indication of long-term momentum flow and trend bias.
Key Signals:
1. EMA9 crosses above WMA45: Momentum turning bullish → potential buy signal.
2. EMA9 crosses below WMA45: Momentum turning bearish → potential sell signal.
3. RSI above 50 + EMA9 above WMA45: Strong bullish environment.
4. RSI below 50 + EMA9 below WMA45: Strong bearish environment.
5. RSI approaching 70/30: Warning zones for exhaustion or potential reversals.
Use Cases:
• Spot momentum reversals earlier than RSI alone.
• Confirm entries when price structure and momentum agree.
• Filter out false breakouts during low-volatility or choppy conditions.
• Strength-based scalping, swing trading, or trend following.
Best Timeframes:
Works on all timeframes, especially effective on M1–M15 for scalping and H1–H4 for swing trading.
Open-source Skript
Ganz im Sinne von TradingView hat dieser Autor sein/ihr Script als Open-Source veröffentlicht. Auf diese Weise können nun auch andere Trader das Script rezensieren und die Funktionalität überprüfen. Vielen Dank an den Autor! Sie können das Script kostenlos verwenden, aber eine Wiederveröffentlichung des Codes unterliegt unseren Hausregeln.
Haftungsausschluss
Die Informationen und Veröffentlichungen sind nicht als Finanz-, Anlage-, Handels- oder andere Arten von Ratschlägen oder Empfehlungen gedacht, die von TradingView bereitgestellt oder gebilligt werden, und stellen diese nicht dar. Lesen Sie mehr in den Nutzungsbedingungen.