OPEN-SOURCE SCRIPT
Aktualisiert Quantile Support & Resistance
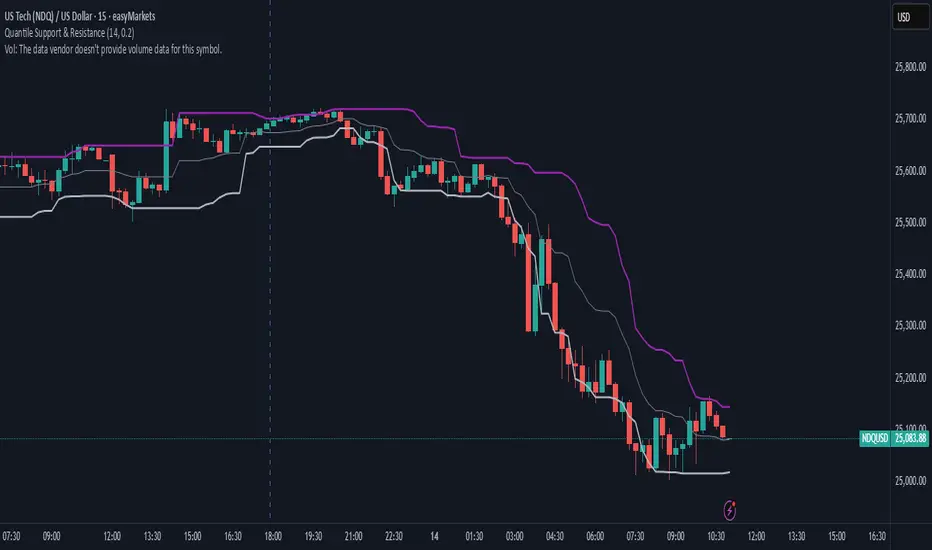
This indicator plots dynamic support and resistance zones based on quantile logic — a statistically grounded method for identifying structural price boundaries.
Support Level: The price below which only a small percentage of lows fall (default: 10%). This approximates a strong demand zone.
Resistance Level: The price above which only a small percentage of highs rise (default: 10%). This approximates a strong supply zone.
Volatility-Adaptive: Levels adjust automatically to changing market conditions using a configurable lookback window.
Quantile Interpolation: Uses sorted price data and fractional indexing to estimate percentile thresholds with precision.
This tool is ideal for traders who want to visualize statistically significant price zones without relying on subjective drawing or fixed levels. It pairs well with breakout strategies, retest logic, and compression overlays.
Versionshinweise
Update:Added midpoint band for clearer mean-reversion targeting
Refreshed color scheme for improved visual contrast and clarity
Changed default inputs for a better fit
This enhances structural readability and makes entry/exit zones more intuitive across timeframes.
Open-source Skript
Ganz im Sinne von TradingView hat dieser Autor sein/ihr Script als Open-Source veröffentlicht. Auf diese Weise können nun auch andere Trader das Script rezensieren und die Funktionalität überprüfen. Vielen Dank an den Autor! Sie können das Script kostenlos verwenden, aber eine Wiederveröffentlichung des Codes unterliegt unseren Hausregeln.
Haftungsausschluss
Die Informationen und Veröffentlichungen sind nicht als Finanz-, Anlage-, Handels- oder andere Arten von Ratschlägen oder Empfehlungen gedacht, die von TradingView bereitgestellt oder gebilligt werden, und stellen diese nicht dar. Lesen Sie mehr in den Nutzungsbedingungen.