OPEN-SOURCE SCRIPT
Aktualisiert ADX and DI EMA Trend Line
ADX: The average directional index (ADX) is a technical analysis indicator used by some traders to determine the strength of a trend.
DI: The directional movement index (DMI) is an indicator developed by J. Welles Wilder in 1978 that identifies in which direction the price of an asset is moving. ... Conversely, if -DI is above +DI, then there is more downward pressure on the price. This indicator may help traders assess the trend direction.
EMA: The exponential moving average (EMA) is a technical chart indicator that tracks the price of an investment (like a stock or commodity) over time. The EMA is a type of weighted moving average (WMA) that gives more weighting or importance to recent price data.
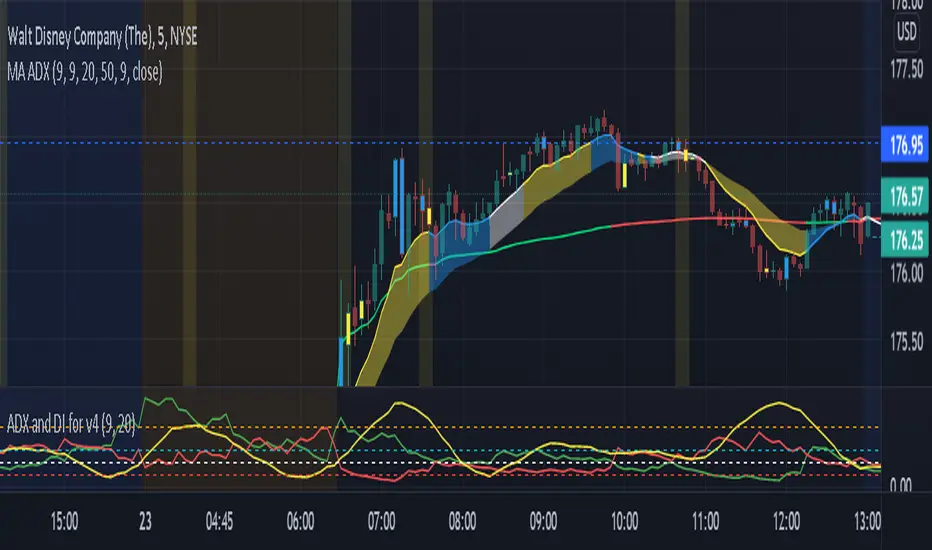
UPDATE: This current indicator has been changed from MA and EMA trend lines the 9 and the 50, and also added Inside & Outside bars...You can toggle anything Off or On
The code in this indicator calculates the value of each ADX and DI (+/-) value to give a green color for DI + trend and a red color for DI - trend, and lastly white for no direction...The nice part of this code is the 50 EMA will be your bull or bear transition level. The colors heading to the ema will tell you if we are still bull or bear heading to the EMA.
I also changed the ADX to become the 9 EMA with Yellow showing a ADX positive rate of change, Blue showing a negative rate of change, and white to show that the trend has no direction.
Open settings to adjust how big or small you want the ema lines to be and adjust colors for what works for you. Hopefully you enjoy this update
DI: The directional movement index (DMI) is an indicator developed by J. Welles Wilder in 1978 that identifies in which direction the price of an asset is moving. ... Conversely, if -DI is above +DI, then there is more downward pressure on the price. This indicator may help traders assess the trend direction.
EMA: The exponential moving average (EMA) is a technical chart indicator that tracks the price of an investment (like a stock or commodity) over time. The EMA is a type of weighted moving average (WMA) that gives more weighting or importance to recent price data.
UPDATE: This current indicator has been changed from MA and EMA trend lines the 9 and the 50, and also added Inside & Outside bars...You can toggle anything Off or On
The code in this indicator calculates the value of each ADX and DI (+/-) value to give a green color for DI + trend and a red color for DI - trend, and lastly white for no direction...The nice part of this code is the 50 EMA will be your bull or bear transition level. The colors heading to the ema will tell you if we are still bull or bear heading to the EMA.
I also changed the ADX to become the 9 EMA with Yellow showing a ADX positive rate of change, Blue showing a negative rate of change, and white to show that the trend has no direction.
Open settings to adjust how big or small you want the ema lines to be and adjust colors for what works for you. Hopefully you enjoy this update
Versionshinweise
Changed the ADX length to 5 and the di legnth to 3 in order to actually fit the current price action since the bigger values are lagging the price action... Also I changed the ADX 50 ema to become Vwap since that calculates current day price action. A Lot of people use vwap for easy bull or bear trend sentiment.Versionshinweise
Update 09/23/2021 Since a lot of people are using this now, I decided to update the code for everyone.
#1 The length has been changed to worked with my other ADX levels... the DI and ADX has been changed to length 9
#2 I added EMA clouds of 9 and 21 so you can see where to buy in, if you missed your entry...the clouds turn color to show strength in the trend
#3 I also added the Trading Warz Nirvana pattern where you have double inside or double outside bars
#4 I changed the outside bars to blue color
Remember if you go to setttings you please changes the colors and sizes to what works best for you
Thanks for the support and love all of you guys!!!!
Open-source Skript
Ganz im Sinne von TradingView hat dieser Autor sein/ihr Script als Open-Source veröffentlicht. Auf diese Weise können nun auch andere Trader das Script rezensieren und die Funktionalität überprüfen. Vielen Dank an den Autor! Sie können das Script kostenlos verwenden, aber eine Wiederveröffentlichung des Codes unterliegt unseren Hausregeln.
Haftungsausschluss
Die Informationen und Veröffentlichungen sind nicht als Finanz-, Anlage-, Handels- oder andere Arten von Ratschlägen oder Empfehlungen gedacht, die von TradingView bereitgestellt oder gebilligt werden, und stellen diese nicht dar. Lesen Sie mehr in den Nutzungsbedingungen.