OPEN-SOURCE SCRIPT
Vertical and Horizontal Lines on given Dates

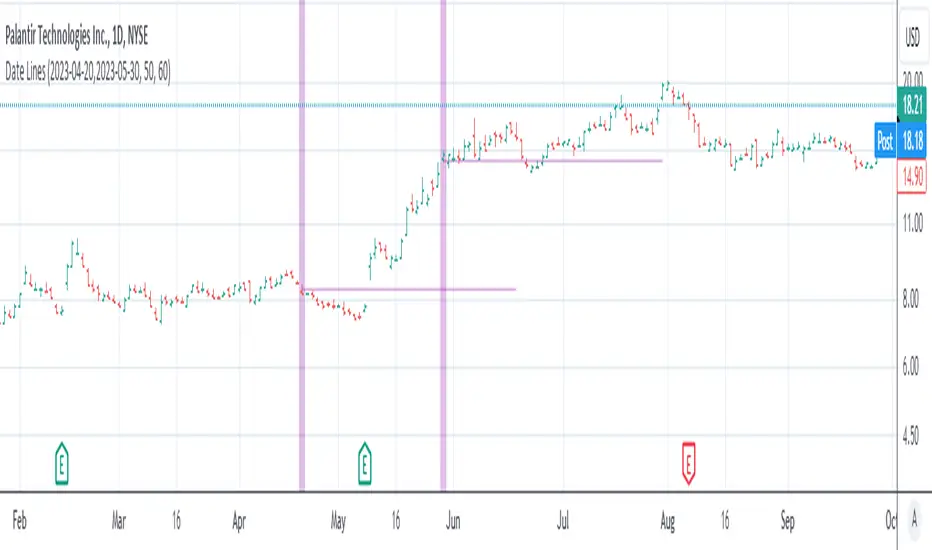
This simple indicator is to show the impact of given dates on the chart:
The dates need to be entered in a yyyy-MM-dd format, separated by comma (,) or space+comma ( ,).
The event can be shown on the chart with a vertical highlighting.
The midpoint of the price action that day can be shown as a vertical line.
Hint: If you load a lot of dates into it, best disable the "Indicator Arguments" in "Chart Settings" -> "Status line" to not have the chart littered with these date arguments.
Open-source Skript
Ganz im Sinne von TradingView hat dieser Autor sein/ihr Script als Open-Source veröffentlicht. Auf diese Weise können nun auch andere Trader das Script rezensieren und die Funktionalität überprüfen. Vielen Dank an den Autor! Sie können das Script kostenlos verwenden, aber eine Wiederveröffentlichung des Codes unterliegt unseren Hausregeln.
Haftungsausschluss
Die Informationen und Veröffentlichungen sind nicht als Finanz-, Anlage-, Handels- oder andere Arten von Ratschlägen oder Empfehlungen gedacht, die von TradingView bereitgestellt oder gebilligt werden, und stellen diese nicht dar. Lesen Sie mehr in den Nutzungsbedingungen.