PROTECTED SOURCE SCRIPT
Stock Scanner - 38 Assets

Pullback Scanner and Trading Strategy:
The Scanner's Purpose:
This tool helps identify stocks and futures from a set-list that are in a strong uptrend (above 200 SMA) but experiencing a temporary pullback (RSI below 38), creating potential buying opportunities.
Load 38 Favourite Stocks. They need to be bullish ie: Trading usually above 200 SMA. A drop down switch lets you choose which group. You can find suitable stocks using the filter at FINVIZ:
use on 4hr Timeframes and Above
You must use this on at least the 4hr timeframe, otherwise the 200SMA is not truly placed correctly and a valid trade depends upon the price action being ABOVE the 200SMA.
finviz.com/screener.ashx?v=111&f=cap_mega,ta_sma200_pa10&ft=4
Key Components:
200 Simple Moving Average (SMA)
Acts as a trend filter
Price above 200 SMA indicates a long-term uptrend
Helps avoid trading against the main trend
Relative Strength Index (RSI)
Set to 38 as the oversold threshold
Identifies temporary weakness in strong trends
Acts as the pullback confirmation. You could add an RSI indicator to the chart for monitoring.
Visual Signals:
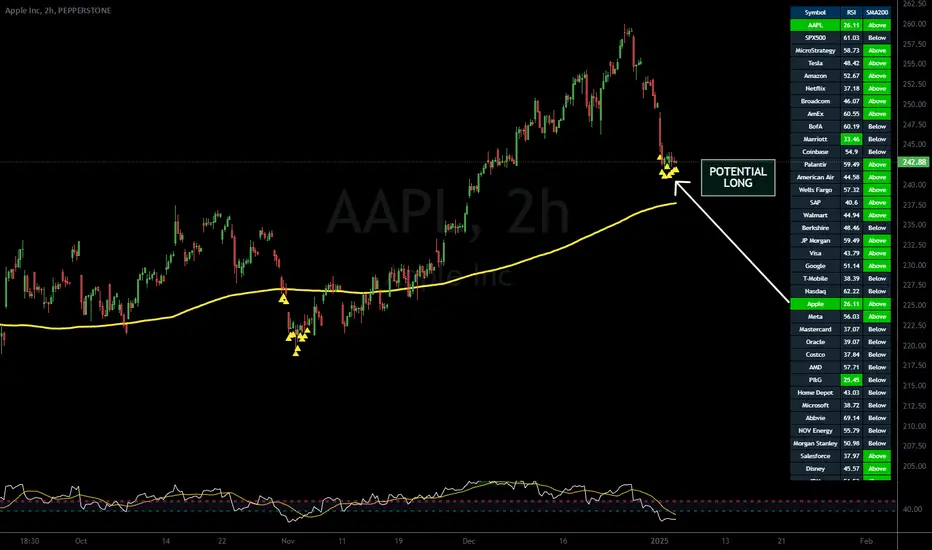
Green row: Indicates both conditions are met (price > 200 SMA and RSI < 38)
Yellow triangle: Appears at price bottom when RSI drops below 38
Yellow 200 SMA line: Shows the trend direction and potential support
Trade Setup:
First Requirement: Price must be trading above the 200 SMA
Second Requirement: Wait for RSI to drop below 38
Entry Trigger: When both conditions align (row turns green)
Risk Management: Set stop loss below recent swing low
Exit: When RSI moves above 53 or price crosses below 200 SMA
The scanner monitors multiple instruments simultaneously, allowing traders to identify setups across different markets without manually checking each chart. When a row turns green, that instrument deserves closer attention for potential trade setup.
Example Trade:
Looking at the chart of Apple (AAPL), the yellow triangles show where RSI dropped below 38 while price remained above the rising 200 SMA, providing multiple long entry opportunities in an established uptrend. Actually Apple may be better with RSI below 26.
If you use ctrader, I have made a cbot version of this to automatically take trades on the ctrader platform: eg: XAUUSD i.postimg.cc/knhF7Jnn/XAUUSD-Pullback-v2.jpg
Geschütztes Skript
Dieses Script ist als Closed-Source veröffentlicht. Sie können es kostenlos und ohne Einschränkungen verwenden – erfahren Sie hier mehr.
Haftungsausschluss
Die Informationen und Veröffentlichungen sind nicht als Finanz-, Anlage-, Handels- oder andere Arten von Ratschlägen oder Empfehlungen gedacht, die von TradingView bereitgestellt oder gebilligt werden, und stellen diese nicht dar. Lesen Sie mehr in den Nutzungsbedingungen.