OPEN-SOURCE SCRIPT
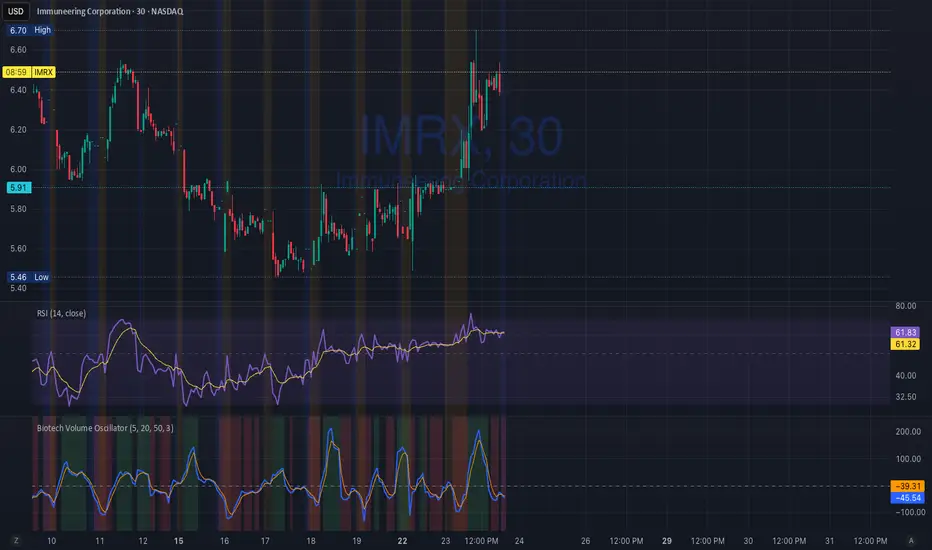
Biotech Volume Oscillator
1️⃣ What This Indicator Is (In One Sentence)
It tells you whether people are actually showing up to trade the stock, or if price is just drifting around on low interest.
That’s it.
It does not predict price.
It tells you whether a move is real or fragile.
2️⃣ What the Lines Mean
You see two lines:
🔵 Blue Line = Live Participation
Fast
Reacts immediately
Shows what traders are doing right now
Think:
“Is anyone actually trading this candle?”
🟠 Orange Line = Accepted Participation
Slower
Smoothed
Shows what the market has decided is normal
Think:
“Is this level of activity sticking?”
3️⃣ What the Numbers Mean (Very Important)
The numbers are percentages vs normal volume for this stock.
Around 0
Volume is normal
Nothing special happening
+10 to +25
Healthy interest
Traders are paying attention
Moves can continue
Above +25
Abnormal participation
News, hype, or institutions involved
Moves here tend to be fast
Below –20
Participation drying up
Drift, chop, fake breakouts
Below –30
Nobody is home
Price can move, but it’s fragile
Breakouts usually fail
4️⃣ How to Use It (Step-by-Step)
Step 1: Ignore Price for a Second
Look only at the oscillator.
Ask:
“Is this above zero or below zero?”
Step 2: Look at Direction
Rising oscillator → interest increasing
Falling oscillator → interest fading
Step 3: Compare Blue vs Orange
✅ Good / Healthy
Blue above orange
Both rising
→ New participation is entering
⚠️ Warning
Price rising
Blue flat or falling
Orange flat
→ Float, not conviction
🚨 Distribution
Blue rolls over from high levels
Orange follows
Price still looks “fine”
→ Selling into strength
Open-source Skript
Ganz im Sinne von TradingView hat dieser Autor sein/ihr Script als Open-Source veröffentlicht. Auf diese Weise können nun auch andere Trader das Script rezensieren und die Funktionalität überprüfen. Vielen Dank an den Autor! Sie können das Script kostenlos verwenden, aber eine Wiederveröffentlichung des Codes unterliegt unseren Hausregeln.
Haftungsausschluss
Die Informationen und Veröffentlichungen sind nicht als Finanz-, Anlage-, Handels- oder andere Arten von Ratschlägen oder Empfehlungen gedacht, die von TradingView bereitgestellt oder gebilligt werden, und stellen diese nicht dar. Lesen Sie mehr in den Nutzungsbedingungen.