OPEN-SOURCE SCRIPT
Aktualisiert Candle Pattern Probability
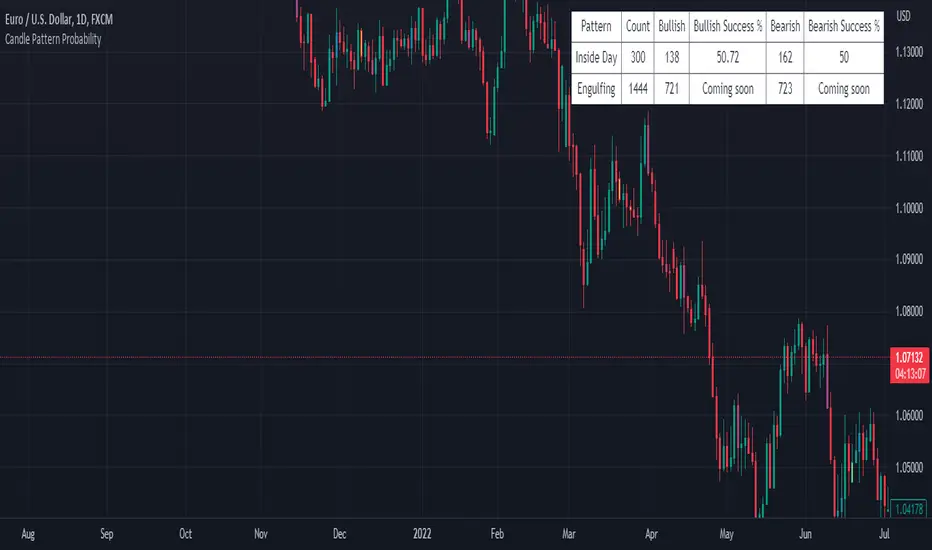
The "Candle Pattern Probability" indicator is a technical analysis tool designed specifically for traders who want to assess the probability of success for different candlestick patterns in the financial markets.
Japanese candlesticks, also known as candlesticks, provide valuable information about price action within a specific time period. These candlestick patterns can help identify potential trend reversals as well as signal entry and exit points in the market.
The "Candle Pattern Probability" indicator uses a data-driven approach to calculate the likelihood of a specific candlestick pattern resulting in a successful price movement. It operates on the premise that certain candlestick patterns tend to repeat and have a higher probability of leading to predictable market movements.
The indicator analyzes a wide variety of candlestick patterns such as the hammer, shooting star, bullish/bearish engulfing, doji, hanging man, among others. It employs specific statistics and algorithms to evaluate the frequency and effectiveness of these patterns in the past, thereby estimating the probability of their repetition in the future.
The indicator's output is visually presented as a percentage value or a color scale, facilitating interpretation by traders. The higher the percentage value or the more intensified the color, the greater the estimated probability of success for the analyzed candlestick pattern.
It is important to note that the "Candle Pattern Probability" indicator is a supplementary tool and should not be considered as a definitive signal for trading decisions. It is recommended to use it in conjunction with other technical indicators, fundamental analysis, and a sound understanding of the market before making trades.
Please remember that the analysis of candlestick patterns and the use of this indicator require practice, experience, and trading knowledge. It is always advisable to conduct additional testing and validation before basing decisions solely on the results provided by this indicator.
Versionshinweise
Preparing for "Coming soon" changesOpen-source Skript
Ganz im Sinne von TradingView hat dieser Autor sein/ihr Script als Open-Source veröffentlicht. Auf diese Weise können nun auch andere Trader das Script rezensieren und die Funktionalität überprüfen. Vielen Dank an den Autor! Sie können das Script kostenlos verwenden, aber eine Wiederveröffentlichung des Codes unterliegt unseren Hausregeln.
Haftungsausschluss
Die Informationen und Veröffentlichungen sind nicht als Finanz-, Anlage-, Handels- oder andere Arten von Ratschlägen oder Empfehlungen gedacht, die von TradingView bereitgestellt oder gebilligt werden, und stellen diese nicht dar. Lesen Sie mehr in den Nutzungsbedingungen.
Open-source Skript
Ganz im Sinne von TradingView hat dieser Autor sein/ihr Script als Open-Source veröffentlicht. Auf diese Weise können nun auch andere Trader das Script rezensieren und die Funktionalität überprüfen. Vielen Dank an den Autor! Sie können das Script kostenlos verwenden, aber eine Wiederveröffentlichung des Codes unterliegt unseren Hausregeln.
Haftungsausschluss
Die Informationen und Veröffentlichungen sind nicht als Finanz-, Anlage-, Handels- oder andere Arten von Ratschlägen oder Empfehlungen gedacht, die von TradingView bereitgestellt oder gebilligt werden, und stellen diese nicht dar. Lesen Sie mehr in den Nutzungsbedingungen.