OPEN-SOURCE SCRIPT
Dynamic Candle Range Point Indicator
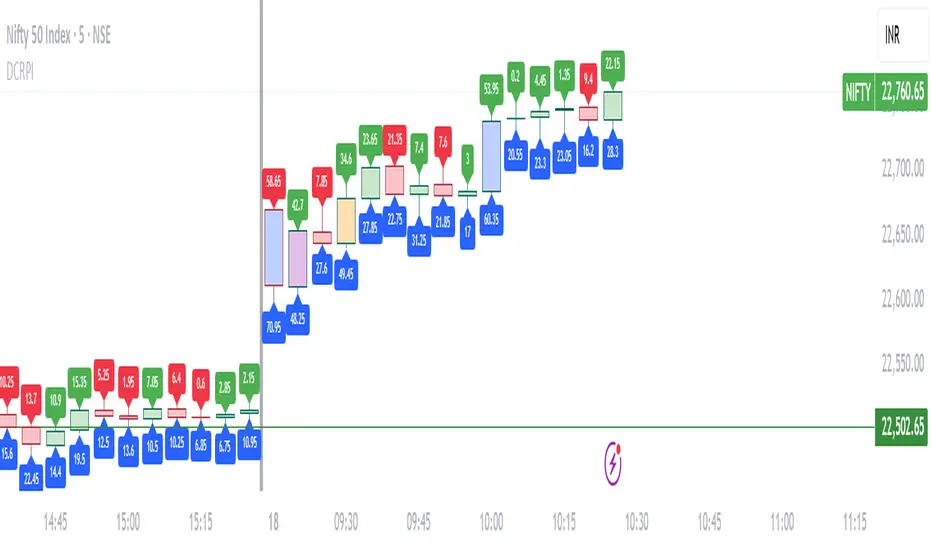
The "Dynamic Candle Range Point Indicator" (DCRPI) does two important jobs at once. For each candle on your chart, it shows you exactly how many points the price moved in two different ways:
1. At the top of each candle, you'll see how many points the price moved from open to close (the body range)
2. At the bottom, you'll see the total movement from the highest to lowest point (the full range)
The really smart part is how it colors the borders of candles based on how much the price moved. This gives you a quick visual way to spot significant price movements:
- Small movements keep the standard green/red colors
- Medium movements (25-30 points) show as yellow
- Larger movements get more unique colors (orange, purple, blue, etc.)
This makes it easy to instantly identify which candles had the most significant price movement without having to read all the numbers. You can quickly spot the most volatile candles across your chart by their distinctive border colors.
The indicator is lightweight and should run smoothly on most charts without causing performance issues.
Open-source Skript
Ganz im Sinne von TradingView hat dieser Autor sein/ihr Script als Open-Source veröffentlicht. Auf diese Weise können nun auch andere Trader das Script rezensieren und die Funktionalität überprüfen. Vielen Dank an den Autor! Sie können das Script kostenlos verwenden, aber eine Wiederveröffentlichung des Codes unterliegt unseren Hausregeln.
Haftungsausschluss
Die Informationen und Veröffentlichungen sind nicht als Finanz-, Anlage-, Handels- oder andere Arten von Ratschlägen oder Empfehlungen gedacht, die von TradingView bereitgestellt oder gebilligt werden, und stellen diese nicht dar. Lesen Sie mehr in den Nutzungsbedingungen.