PROTECTED SOURCE SCRIPT
Aktualisiert UDI Directional Lines 5/20ema
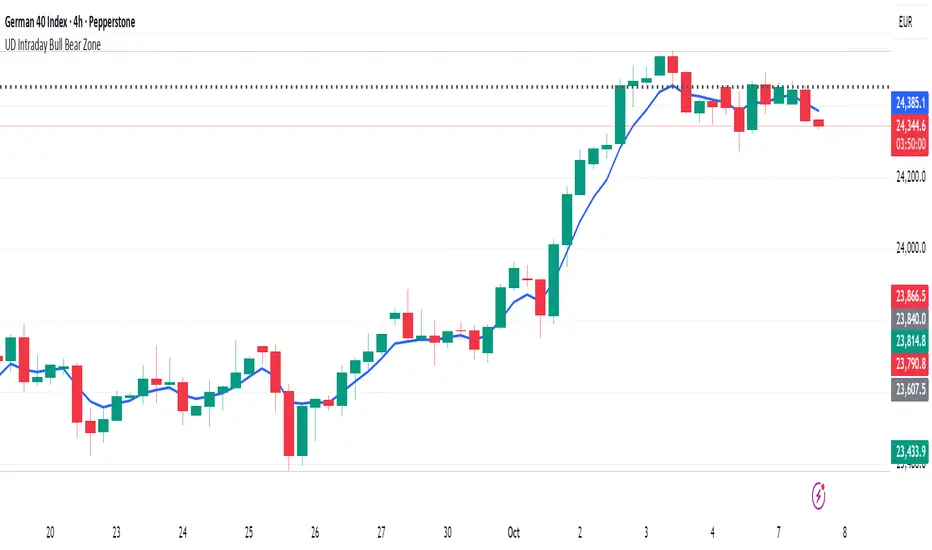
This indicator indicates the use of ema lines to determine the change of directions where:
- 5ema black line indicates small trend shift
- 20ema red line indicates big trend shift
On top of it the circles below the chart shows the momentum to execute where
- green indicates bull trend and cycle
- red indicates red trend and cycle
With the combination of direction and momentum there will be more accuracy in tracking the trend movement of a particular asset
Versionshinweise
The blue line is the line that indicates the bull bear zone of the intraday movement where candle closing above is entering Bull and Below is entering BearGeschütztes Skript
Dieses Script ist als Closed-Source veröffentlicht. Sie können es kostenlos und ohne Einschränkungen verwenden – erfahren Sie hier mehr.
Ups and Downs by Entreuverse
Haftungsausschluss
Die Informationen und Veröffentlichungen sind nicht als Finanz-, Anlage-, Handels- oder andere Arten von Ratschlägen oder Empfehlungen gedacht, die von TradingView bereitgestellt oder gebilligt werden, und stellen diese nicht dar. Lesen Sie mehr in den Nutzungsbedingungen.
Geschütztes Skript
Dieses Script ist als Closed-Source veröffentlicht. Sie können es kostenlos und ohne Einschränkungen verwenden – erfahren Sie hier mehr.
Ups and Downs by Entreuverse
Haftungsausschluss
Die Informationen und Veröffentlichungen sind nicht als Finanz-, Anlage-, Handels- oder andere Arten von Ratschlägen oder Empfehlungen gedacht, die von TradingView bereitgestellt oder gebilligt werden, und stellen diese nicht dar. Lesen Sie mehr in den Nutzungsbedingungen.