INVITE-ONLY SCRIPT
Bollinger Bands
Aktualisiert
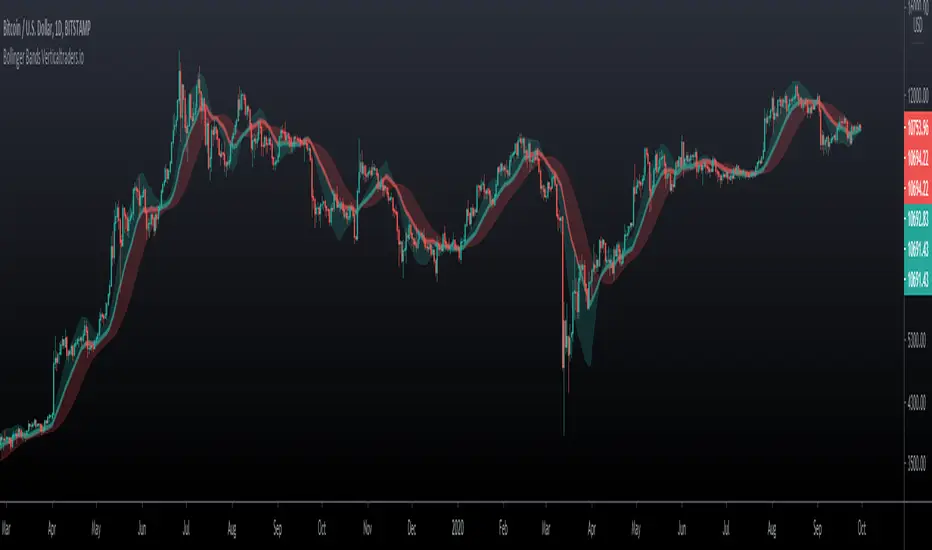
Bollinger bands are calculated from a moving average, creating two curves that involve the price chart, these bands are defined by a standard deviation generally of value 2 with respect to the moving average.
Applications:
- They show the volatility of the market, when the bands are compressed, the volatility decreases, when the bands extend, the volatility increases.
- Trend, with respect to the moving average according to the location of the price corresponding to the positive or negative standard deviation.
Extra functions in this indicator:
- You can use several types of moving averages for the calculation: SMA, EMA, DEMA, TEMA, WMA, VWMA, HullMA, TMA, SMMA, SSMA, etc.
- Background: Shows the zone equivalent to a standard deviation of 1 and 2 with different color.
- Log chart: It can be used on logarithmic price scales, to avoid distortions in those charts.
- Multimeframe: so you can visualize the behavior in different timeframes without changing timeframe.
- Interpolation: Round the curves when viewing larger timeframes.
Multitimeframe example: 1D, select timeframe to Bollinger bands 1W and log chart

Same chart with interpolation

Applications:
- They show the volatility of the market, when the bands are compressed, the volatility decreases, when the bands extend, the volatility increases.
- Trend, with respect to the moving average according to the location of the price corresponding to the positive or negative standard deviation.
Extra functions in this indicator:
- You can use several types of moving averages for the calculation: SMA, EMA, DEMA, TEMA, WMA, VWMA, HullMA, TMA, SMMA, SSMA, etc.
- Background: Shows the zone equivalent to a standard deviation of 1 and 2 with different color.
- Log chart: It can be used on logarithmic price scales, to avoid distortions in those charts.
- Multimeframe: so you can visualize the behavior in different timeframes without changing timeframe.
- Interpolation: Round the curves when viewing larger timeframes.
Multitimeframe example: 1D, select timeframe to Bollinger bands 1W and log chart
Same chart with interpolation
Versionshinweise
V 2.0Skript nur auf Einladung
Der Zugriff auf dieses Skript ist auf vom Autor autorisierte User beschränkt und normalerweise kostenpflichtig. Sie können es zu Ihren Favoriten hinzufügen, aber Sie können es nur verwenden, nachdem Sie die Erlaubnis angefordert und vom Autor erhalten haben. Kontaktieren Sie Vertical-X für weitere Informationen oder folgen Sie den Anweisungen des Autors unten.
TradingView empfiehlt nicht, ein Script zu kaufen, wenn Sie den Autor nicht zu 100 % als vertrauenswürdig halten, oder nicht verstehen, wie das Script funktioniert. In vielen Fällen können Sie auch eine gute und kostenlose Open-Source-Alternative in unseren Community-Scripts entdecken.
Hinweise des Autors
″
Möchten Sie dieses Skript auf einem Chart verwenden?
Warnung: Bitte lesen Sie dies, bevor Sie Zugriff anfordern.
🔰 The Best Trading Indicators: links.verticaltraders.io
Haftungsausschluss
Die Informationen und Veröffentlichungen sind nicht als Finanz-, Anlage-, Handels- oder andere Arten von Ratschlägen oder Empfehlungen gedacht, die von TradingView bereitgestellt oder gebilligt werden, und stellen diese nicht dar. Lesen Sie mehr in den Nutzungsbedingungen.