OPEN-SOURCE SCRIPT
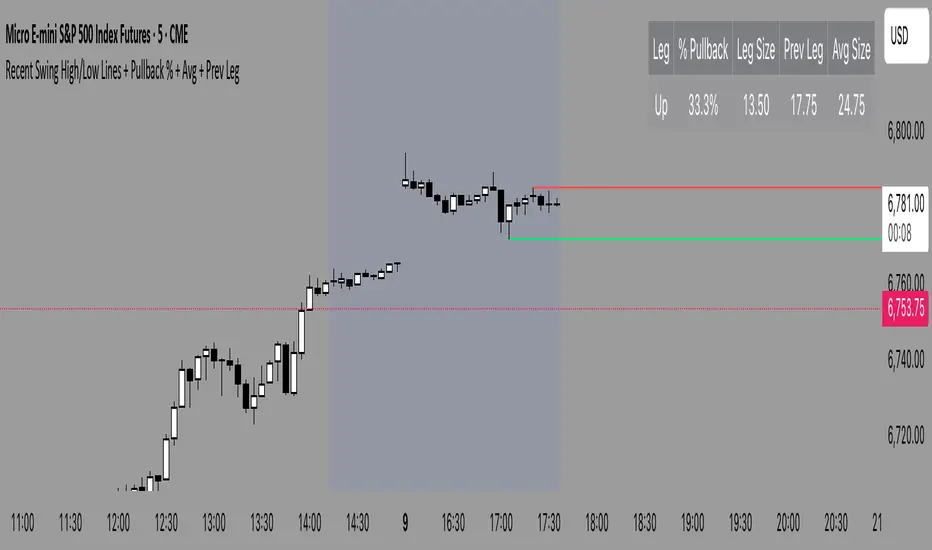
Recent Swing High/Low Lines With Stats Table
Swing-Based Volatility
This indicator measures volatility using the distance between recent swing highs and swing lows rather than fixed averages like ATR. Each swing captures a meaningful shift in market control, making this a structure-aware view of volatility.
The tool calculates and plots the average swing range over time, highlighting when the market is expanding (wide swings, high volatility) or contracting (tight swings, low volatility). These phases can help traders identify breakout potential, adjust stop-loss or profit targets, and align position sizing with current market conditions.
Open-source Skript
Ganz im Sinne von TradingView hat dieser Autor sein/ihr Script als Open-Source veröffentlicht. Auf diese Weise können nun auch andere Trader das Script rezensieren und die Funktionalität überprüfen. Vielen Dank an den Autor! Sie können das Script kostenlos verwenden, aber eine Wiederveröffentlichung des Codes unterliegt unseren Hausregeln.
Haftungsausschluss
Die Informationen und Veröffentlichungen sind nicht als Finanz-, Anlage-, Handels- oder andere Arten von Ratschlägen oder Empfehlungen gedacht, die von TradingView bereitgestellt oder gebilligt werden, und stellen diese nicht dar. Lesen Sie mehr in den Nutzungsbedingungen.