OPEN-SOURCE SCRIPT
BBMan with EMAs
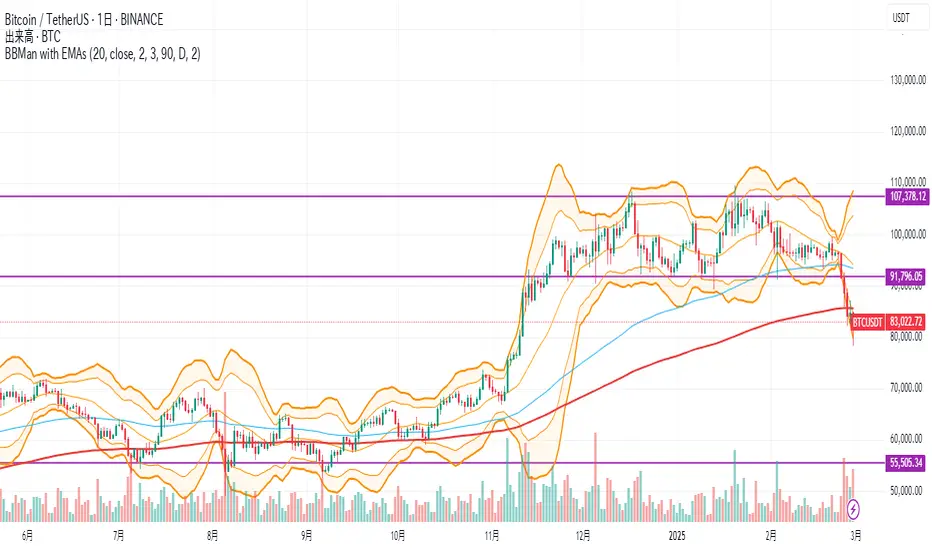
BBMan (Bollinger Bands Manager)
Created by: Hiroshi Yoshitaka
Website: cryptrader.net
Description:
A comprehensive Bollinger Bands indicator that combines standard deviation bands (2σ and 3σ) with key EMAs (100 and 200) for enhanced technical analysis. The indicator features customizable visual elements and flexible alert conditions.
Key Features:
- Dual Bollinger Bands (2σ and 3σ)
- EMA 100 and 200 overlay
- Customizable color scheme
- Advanced alert system
Components:
1. Bollinger Bands
- Center line (20-period SMA)
- 2σ bands (thinner lines)
- 3σ bands (thicker lines)
- Highlighted area between 2σ and 3σ
2. Moving Averages
- EMA 100 (medium-term trend)
- EMA 200 (long-term trend)
- Toggle option for EMA display
3. Alert System
- Customizable timeframe selection
- Choice between 2σ and 3σ band touches
- Price touch notifications
Visual Settings:
- Orange-based color scheme for bands
- Customizable transparency for highlighted areas
- Different line weights for 2σ and 3σ bands
- Distinct colors for EMAs (blue for 100, red for 200)
Use Cases:
- Volatility analysis
- Trend identification
- Support/resistance levels
- Overbought/oversold conditions
- Price reversal signals
The indicator is designed for traders who want a clean, professional view of price action relative to standard deviation bands while maintaining awareness of key moving averages.
Open-source Skript
Ganz im Sinne von TradingView hat dieser Autor sein/ihr Script als Open-Source veröffentlicht. Auf diese Weise können nun auch andere Trader das Script rezensieren und die Funktionalität überprüfen. Vielen Dank an den Autor! Sie können das Script kostenlos verwenden, aber eine Wiederveröffentlichung des Codes unterliegt unseren Hausregeln.
Haftungsausschluss
Die Informationen und Veröffentlichungen sind nicht als Finanz-, Anlage-, Handels- oder andere Arten von Ratschlägen oder Empfehlungen gedacht, die von TradingView bereitgestellt oder gebilligt werden, und stellen diese nicht dar. Lesen Sie mehr in den Nutzungsbedingungen.