OPEN-SOURCE SCRIPT
Aktualisiert CSRS v2

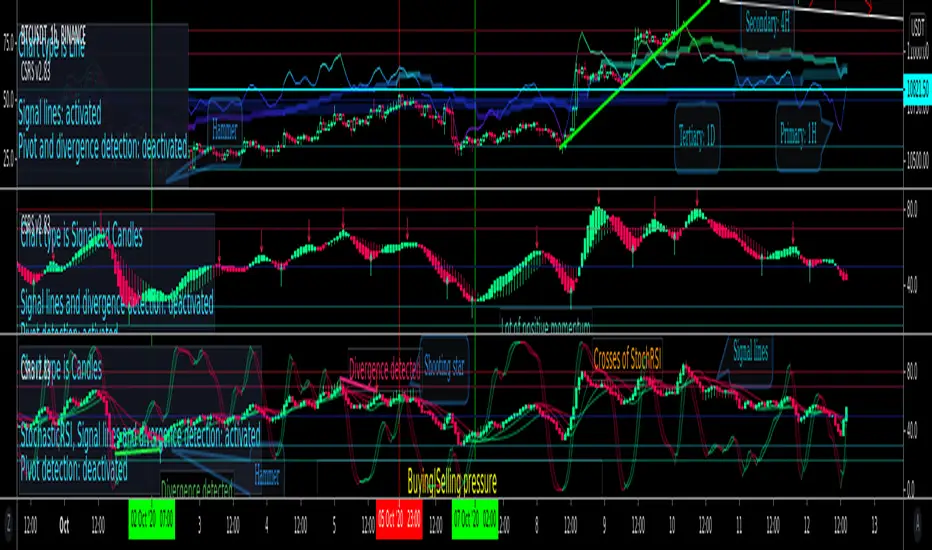
Candlesticked RSI v2 for price action traders!
See the True Momentum.
6 chart type, smooth RSI , add signal lines, find divergences, special alerts
This is 2nd version with major upgrade
Improved and more powerful
fully customizable.
features:
See the True Momentum.
6 chart type, smooth RSI , add signal lines, find divergences, special alerts
This is 2nd version with major upgrade
Improved and more powerful
fully customizable.
features:
- See RSI in 6 type of chart(Candles, Hollow Candles, Siwi Candles, Heikin Ashi, HL Bar, Line)
- Monitor Up to 3 RSI , each one at desired resolution, source and length
- Smooth each one of chart separately to remove noises
- Add up to 3 signal line to primary chart in your desired source and type( SMA , EMA , WMA , HMA )
- Find divergences which has special parameters
- Gradient color adjustment of line chart
- Add alert for reaching to important levels and detected divergences
Versionshinweise
Major UpgradeBugs fixes, Improvements and New Features
Bugs fixed
- Hollow candle and Heikin Ashi weren't work correctly
Improvements
- Divergence detector can use high|low data of selected chart type and adapt itself
- Algorithms have been edited, they are faster and better while they are shorter
New Features
- When we have real information, why not use it? Stochastic RSI is here!
As you know, the input data to Stochastic are close, high, low. Normally this is not possible for Stochasti RSI, so it only can processes one of OHLC as input. But now we were able to generate these data, so we used them to create a real stochastic. Of course its input data will change as you change chart type(like div detector).
- Pivot detection:
You can enter your desired parameters and find pivot points. This feature is very useful for counting price waves and steps and detecting divergences that the system has not been able to find those.
- Signalized Candles chart type:
We were able to add three signal lines to the primary chart. We turned the data of these three lines into candles.
To use this feature, the length of signal lines must be in ascending order. That is, A is faster than B and B is faster than C.
We take the signal line A value as close and B as open.
If this candle is bullish, the signal line C will used as low and vice versa
I set the default values experimentally and they work fine and recommend using the HMA for signal lines type since it react faster. Let me know if you find good settings!
I will publish more about how to use this mode to generate a signal, and I will go into more detail in that.
I hope it will be useful
Let us know what you think
Open-source Skript
Ganz im Sinne von TradingView hat dieser Autor sein/ihr Script als Open-Source veröffentlicht. Auf diese Weise können nun auch andere Trader das Script rezensieren und die Funktionalität überprüfen. Vielen Dank an den Autor! Sie können das Script kostenlos verwenden, aber eine Wiederveröffentlichung des Codes unterliegt unseren Hausregeln.
Haftungsausschluss
Die Informationen und Veröffentlichungen sind nicht als Finanz-, Anlage-, Handels- oder andere Arten von Ratschlägen oder Empfehlungen gedacht, die von TradingView bereitgestellt oder gebilligt werden, und stellen diese nicht dar. Lesen Sie mehr in den Nutzungsbedingungen.