OPEN-SOURCE SCRIPT
Slope Vortex
I stumbled upon creating this and thought it was cool and worth sharing. If anyone has ever dabbled with the Aroon or Vortex Indicators, there is some similarity to how it can be used visually.
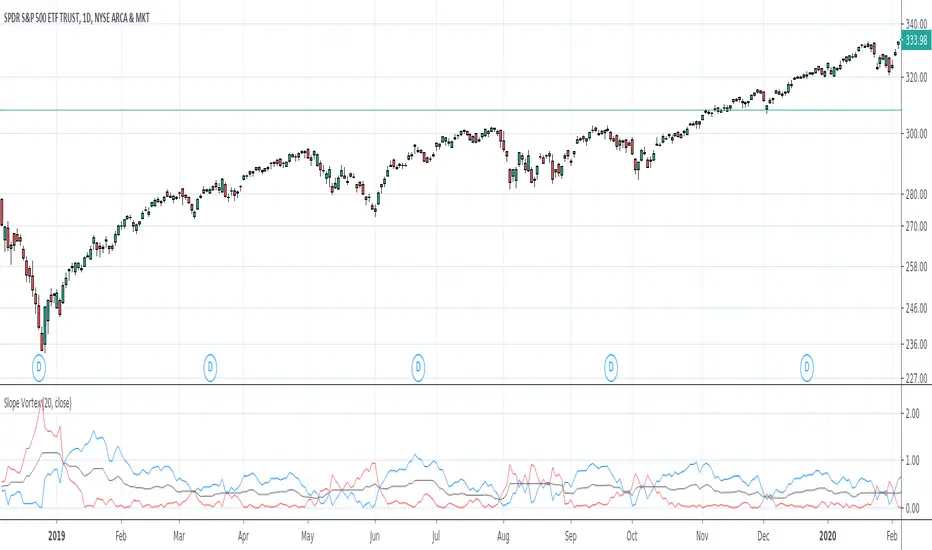
The indicator basically takes two slopes from the trailing time period you indicate- one from the highest point in that time period, and one from the lowest point. It then plots both.
Here are some of the ways I think this indicator can be used--
Here are some snippets of examples I outlined-


I purposely kept this indicator as clean and simple as possible for publication. But I already have tinkered around with taking the output and putting it through the likes of RSI, Stoch, etc. and I think the outcomes are pretty intriguing as well for something so simple. I think dropping the length too much makes it too noisy, so 20, 50, 100 look most useful.
The indicator basically takes two slopes from the trailing time period you indicate- one from the highest point in that time period, and one from the lowest point. It then plots both.
Here are some of the ways I think this indicator can be used--
- Crossover This is the most obvious way, visually. If the blue line crosses under the red, an uptrend has ended or is testing support here. The opposite can be used as well. When the blue line crosses above the red an uptrend is starting or it is testing resistance.
- Trending or Ranging If the two bands are moving away from each other/increasing the width between them, there is definite trending action going on. If the two are very narrow or keep crossing each other, whatever symbol you're looking at is likely ranging or consolidating. The black "midpoint" line can also be used to help identify-- if this line is moving up, regardless of if the blue or red band is above, the trend has momentum; if it is going down or flat the previous trend is either slowing greatly or we are ranging.
- Support & Resistance Crosses can identify meaningful support and resistance. Having both lines kiss or get very close to the black midpoint line but not cross can also indicate S/R or confirm trend strength.
Here are some snippets of examples I outlined-
I purposely kept this indicator as clean and simple as possible for publication. But I already have tinkered around with taking the output and putting it through the likes of RSI, Stoch, etc. and I think the outcomes are pretty intriguing as well for something so simple. I think dropping the length too much makes it too noisy, so 20, 50, 100 look most useful.
Open-source Skript
Ganz im Sinne von TradingView hat dieser Autor sein/ihr Script als Open-Source veröffentlicht. Auf diese Weise können nun auch andere Trader das Script rezensieren und die Funktionalität überprüfen. Vielen Dank an den Autor! Sie können das Script kostenlos verwenden, aber eine Wiederveröffentlichung des Codes unterliegt unseren Hausregeln.
Haftungsausschluss
Die Informationen und Veröffentlichungen sind nicht als Finanz-, Anlage-, Handels- oder andere Arten von Ratschlägen oder Empfehlungen gedacht, die von TradingView bereitgestellt oder gebilligt werden, und stellen diese nicht dar. Lesen Sie mehr in den Nutzungsbedingungen.